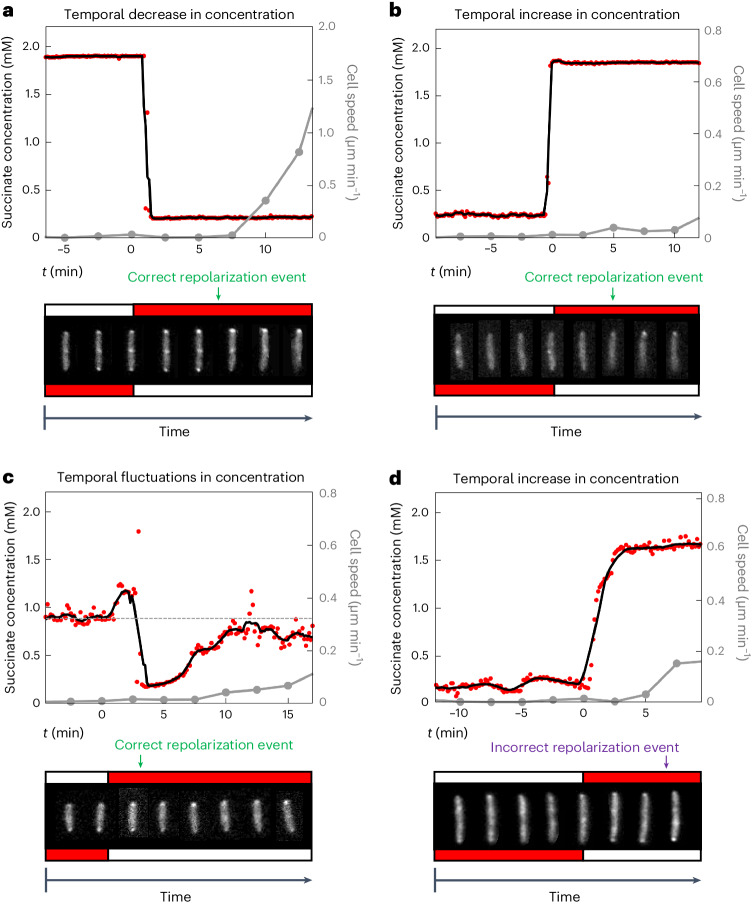
Fig. 5. Stationary cells can sense changes in the orientation of a chemoattractant gradient, despite large temporal fluctuations in concentration.
We simultaneously quantified the succinate concentration that a cell experienced over time (red circles; black line shows moving average), cell speed (grey line) and PilT–YFP localization, as cells were exposed to a succinate gradient that alternates direction. Grey circles indicate time points at which cell images are shown (at 2.5 min intervals). To guide the eye, cell images have been repositioned so that they are vertically oriented and their centroid remains at a fixed position. a, This cell experiences a sharp temporal decrease in succinate concentration when the gradient changes direction. PilT–YFP re-localizes to the cell pole that is now exposed to higher chemoattractant concentrations (a correct repolarization event), and the cell later moves off in the direction of its new leading pole. PilT–YFP is shown in the bottom inset, with red and white boxes indicating high and low succinate concentrations, respectively. b, This cell experiences a sharp increase in succinate concentration over time and also undergoes a correct repolarization event. While PilT–YFP is initially nonpolar, it subsequently re-localizes exclusively to the cell pole positioned in higher succinate concentrations. c, This cell was positioned close to the centreline of the succinate gradient such that when the gradient alternated direction, it experienced noisy fluctuations in succinate concentration, including both increases and decreases in concentration. Despite this, the cell also underwent a correct repolarization event—PilT–YFP was initially localized to both poles (with no observable directional polarity) and subsequently re-localized exclusively to the cell pole positioned in higher succinate concentrations. d, Although less frequent, cells also underwent incorrect repolarization events. Here a cell experiencing an increase in succinate concentration over time re-localizes PilT–YFP to the cell pole positioned in lower succinate concentrations and subsequently moves in that direction. While these four repolarization events are representative, Supplementary Videos 1–16 show every repolarization event that we observed, with a description of how each was classified in Supplementary Table 1. Source data provided as a source data file.

