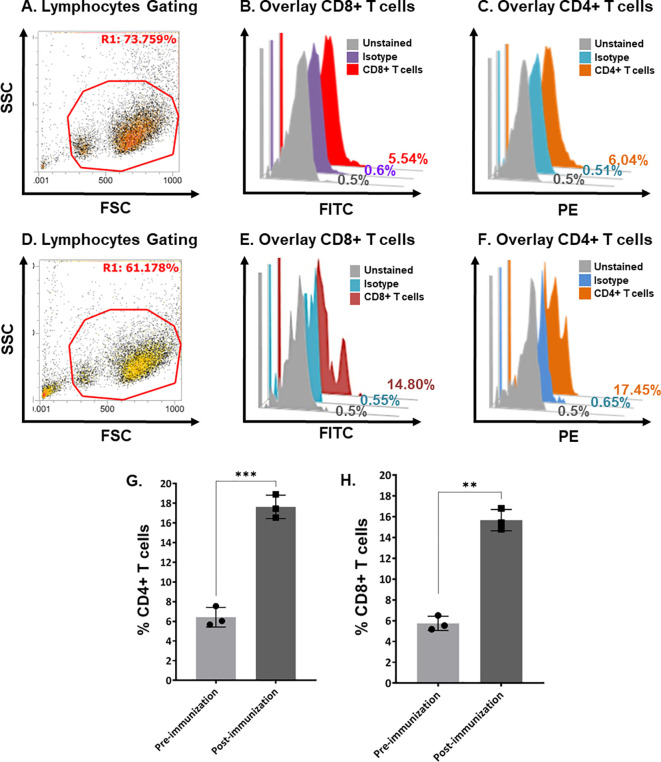
Figure 5.
Quantification of bovine CD4+ and CD8+ T-cells in pre- and post-immunization calves using flow cytometry. (A) Scatter plot showing the gating of lymphocytes in bovine buffy coat cells in pre-immunized calves. (B) Histogram overlay showing unstained cells (gray), isotype control (purple), and CD8+ T-cells (Red) in pre-immunized calves. (C) Histogram overlay showing unstained cells (gray), isotype control (blue), and CD4+ T-cells (brown) in pre-immunized calves. (D) Scatter plot showing the gating of Bovine buffy coat cells in post-immunized calves. (E) Histogram overlay showing unstained cells (gray), isotype control (blue), and CD8+ T-cells (maroon) in post-immunized calves. (F) Histogram overlay showing cells unstained cells (gray), isotype control (blue), and CD4+ T-cells (brown) in post-immunized calves. (G) Bar graph shows a significant increase in CD4+ T-cells at day-21 post-immunization compared with day-0 in calves (p < 0.0005). (H) Bar graph shows a significant increase in CD8+ T-cells at day-21 post-immunization compared with day-0 calves (p < 0.005). FSC, forward scatter; SSC, side scatter; PE, phycoerythrin; FITC, fluorescein isothiocyanate. The stars show the level of significance '***' (p < 0.0005) and '**' (p < 0.005). The lesser the p value, the more significant results are.

