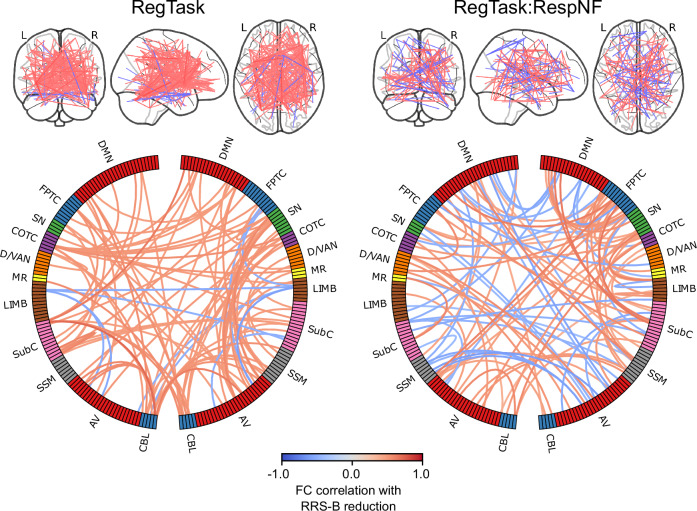
Fig. 4. Plots of the connectivity selected by the CPM model in more than 76% (p < 0.001 with Bonferroni correction) of the cross-validation iterations.
Line color indicates the connectivity correlation with RRS-B change. Warm color indicate that the higher the FC the more RRS-B decreased, and the cool color was vice versa. The circle plots summarized for each network region. Network labels are adapted from Drysdale, Grosenick [53]. DMN Default Mode Network, FPTC Fronto-Parietal Task Control, SN Salience Network, COTC Cingulo-Opperculum Task Control, D/VAN Doral Visual Attention Network, MR Memory Retrieval, LIMB default mode/limbic, SubC Subcortical, SSM Sensory SomatoMotor, AV Auditory-Visual, CBL Cerebellum.

