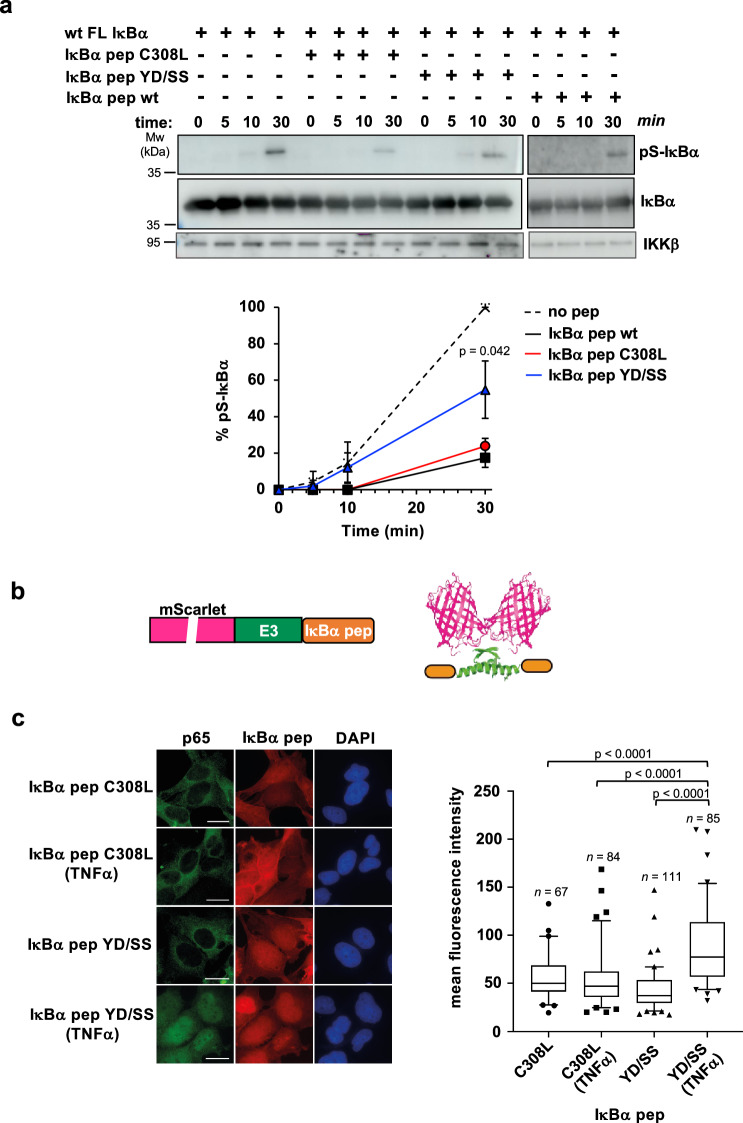
Fig. 4. Inhibition of canonical NF-κB signaling by IκBα pep.
a In vitro inhibition of IKKβ kinase activity by synthetic IκBα pep variants. The experiment uses full-length wt 6xHis-IκBα, endogenous IKK, and an excess of synthetic IκBα pep variants. Samples were run on two separate gels for detection of total IκBα and pS-IκBα. See also legend of Fig. 3a. (Upper panel) Representative Western blot images. All different IκBα pep conditions were migrated with the reference (no peptide) on the same gel (see Source Data file). (Lower panel) Quantification of IκBα phosphorylation levels normalized to the values obtained in the absence of peptide (no peptide) at 30 minutes incubation (100%). The data (mean +/− SD) are obtained from three independent kinase activity experiments. The indicated P-value (p) was obtained from a two-tailed unpaired t-test, n = 3 biological triplicates and reports on differences between IκBα pep YD/SS and IκBα pep wt at t = 30 min. b Schematic representation of mScarlet-E3-IκBα pep constructs. Purple: mScarlet, green: the E3 dimerization peptide; orange: the IκBα pep sequence. c In vivo inhibition of NF-κB signaling by IκBα pep. (Left panel) Immunofluorescent staining of MRC5 cells electroporated with mRNAs coding for mScarlet-E3-IκBα pep fusions. After electroporation, cells were treated or not with TNFα (20 ng/ml) for 30 minutes before fixation. The translated constructs were detected by direct immunofluorescence of the mScarlet (red). p65 was detected using an anti-p65 antibody followed by an anti-mouse Alexa-Fluor 488 (green). Nuclei were stained by DAPI. Scale bar, 10 μm. (Right panel) Mean fluorescence intensities of nuclear p65 in the four conditions. The data are displayed in a box-and-whisker representation showing the median in the center line, the 75/25 percentiles at the boxes, the 5/95 percentiles at the whiskers and the extreme values to the minimum and maximum of the raw fluorescence data. Statistical analysis was performed by ordinary one-way ANOVA test. n: number of cells analyzed. See also Supplementary Fig. 3b for quantification of the nuclear expression levels of IκBα pep fusions. Source data for this figure are provided as a Source Data file.

