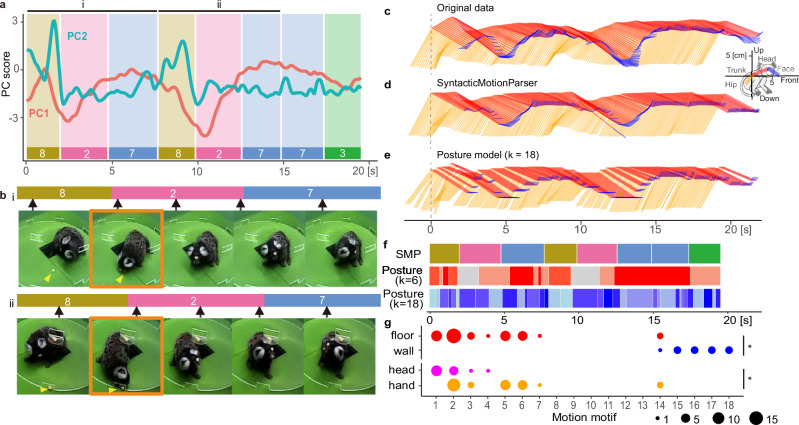
Fig. 3. Example of marmoset behavior smoothly described by SMP-derived motion motifs.
a Example of behavior segmentation. The curve trends represent the 1st and 2nd principal component scores (PC1 and PC2) of the motion parameters. The bottom lines and background rectangles represent the resulting eight segmented motion motifs with four types (motif 8, 2, 7, and 3). b Two sequential images of marmoset free-feeding behaviors with three-segment arrays “8-2-7”, where the labels (i) and (ii) correspond to those in (a). Black arrows indicate the position of the video frame in the segment represented by the upper bar. Yellow arrowheads indicate the location of the food reward. Orange rectangles indicate the images in which feeding occurred. c Time series of the original body movement trajectory during the data from (a), with the X-axis representing time and the front-back direction, and the Y-axis representing the up-down direction. The Face-Head, Head-Trunk, and Trunk-Hip are color-coded in blue, red, and orange, respectively. d The time series of the ideal body motion trajectory, which was pieced together from the eight motion motifs provided by SMP. e Time series connecting the six representative postures provided by the posture model, calculated by clustering the two-dimensional UMAP scores of all data using the k-means hierarchical clustering method (k = 18). See also Supplementary Movie 2. f Segmentation results of the motion sequence c using the proposed SMP method and the posture models (k = 6 and 18). g Dot plots showing the distribution of motion motifs in response to food placed on the wall and floor and in feeding approaches to food placed on the floor (floor-hand and floor-head). Size indicates the number of observations. *p value < 0.05 by Pearson’s Chi-squared test.

