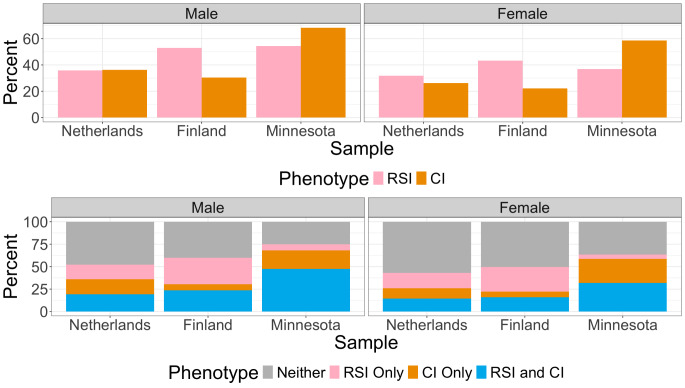
Fig. 2.
Bar charts depicting the prevalence of lifetime smoking and lifetime cannabis use stratified by sex and sample. The top bar chart presents the prevalence of each phenotype separately. The bottom bar chart presents the percentages of individuals who have endorsed neither phenotype, endorsed both phenotypes, and endorsed one phenotype but not the other. RSI refers to regular smoking initiation, CI refers to cannabis initiation

