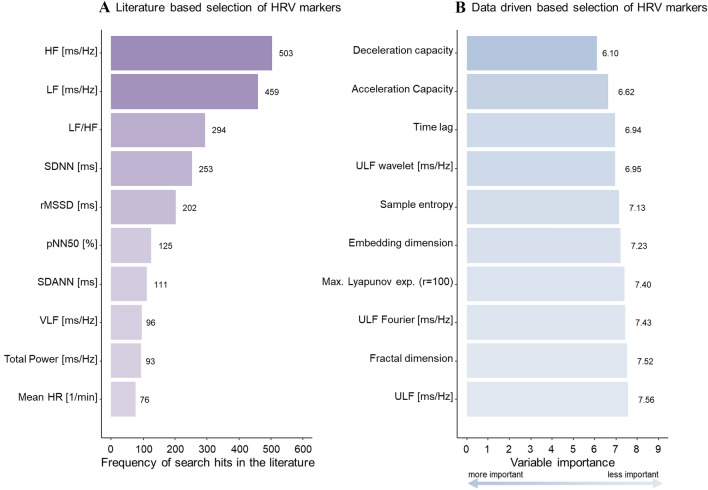
Fig. 1.
Selection of heart rate variability parameters based on a literature search (A) and on a data-driven approach (B). Left (A), the top ten HRV markers retrieved by a systematic literature search from the PubMed database. Right (B), the top 10 HRV markers identified with a random survival forest model with cardiac death as outcome and 62 HRV markers as predictors, adjusted for age and sex, ranked according to the variable importance metric minimal depth, with lower values indicating higher importance. The markers retrieved via the systematic literature search all belong to the time and frequency domains, while the top ten ranked markers from the machine learning model belong mostly to non-linear indices of HRV. The full model is displayed in Supplemental Table 4. HRV, heart rate variability; HF, high frequency; LF, low frequency; SDNN, standard deviation of the NN (normal to normal) intervals in milliseconds; rMSSD, root mean square of successive differences between normal heartbeats; pNN50%, percentage of neighboring NN intervals that differ from each other by more than 50 ms; SDANN, standard deviation of the 5 min average NN intervals; VLF, very low frequency; HR, heart rate; ULF, ultra-low frequency; Max., maximal; r, radius

