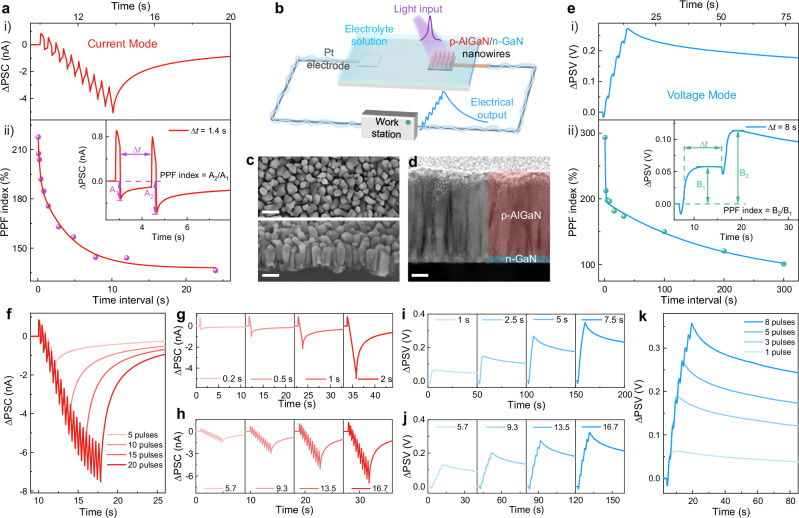
Fig. 2. Structure and dual-modal synaptic behaviors of the photoelectrochemical synapse.
a i): Postsynaptic current (ΔPSC) in response to ten light pulses (tp = Δt = 0.2 s); ii): PPF index versus pulse interval, with the inset showing the PPF effect and its definition. b Schematic of the photoelectrochemical synaptic device. c Top-view SEM image (top; scale bar, 150 nm) and 45°-tilted SEM image of the as-grown nanowires (bottom; scale bar, 150 nm). d STEM image of the as-grown nanowires (scale bar, 50 nm). e i): Postsynaptic voltage (ΔPSV) induced by five light pulses (tp = Δt = 1 s); ii): PPF index versus pulse interval, with the inset showing the PPF effect and its definition. f-h Correlations between ΔPSC and pulse number (f), pulse duration (g), and pulse intensity (h). i–k Correlations between ΔPSV and pulse number (k), pulse duration (i), and pulse intensity (j). Light pulses of 12 µW cm−2 were used, except for the pulse intensity-dependent tests. The inset numbers in (h) and (j) represent different light intensities from 5.7 to 16.7 µW cm−2.

