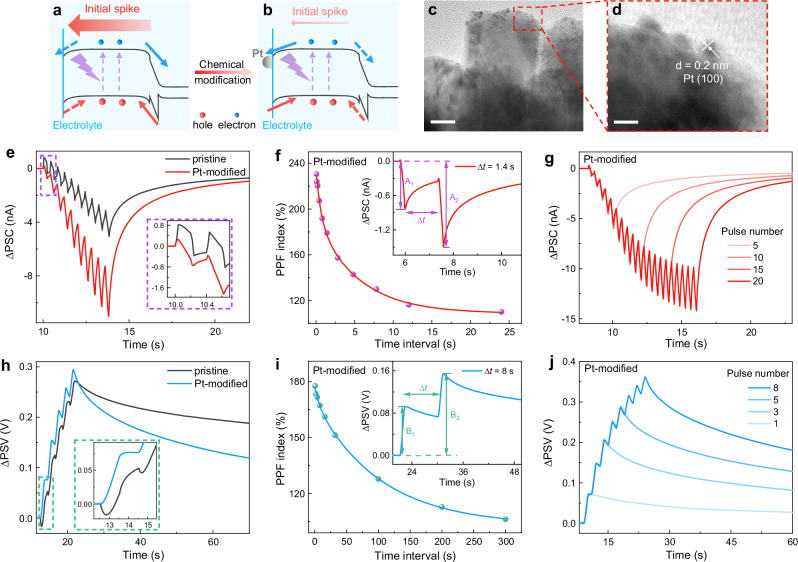
Fig. 4. Synaptic plasticity modulation via surface Pt modification.
a, b Schematic illustrations of the charge carrier behaviors before (a) and after (b) anchoring Pt nanoparticles on the nanowire surface. Arrows are used to indicate the direction of charge carrier transport, with solid arrows representing the dominant charge carrier transfer direction. c TEM image of Pt-modified nanowires (scale bar, 25 nm). d HRTEM image of the red-outlined area (scale bar, 5 nm). e, h PSC curves (e) and PSV curves (h) of pristine device and Pt-modified device with the inset exhibiting an enlarged view of the synaptic responses. f, i PPF curves in current mode (f) and voltage mode (i) with Pt modification, with the inset showing the PPF effect. g, j Synaptic responses with different pulse numbers in current mode (g) and voltage mode (j). Light pulses of 255 nm and 12 µW cm−2 were used. In current mode, tp = Δt = 0.2 s. In voltage mode, tp = Δt = 1 s.

