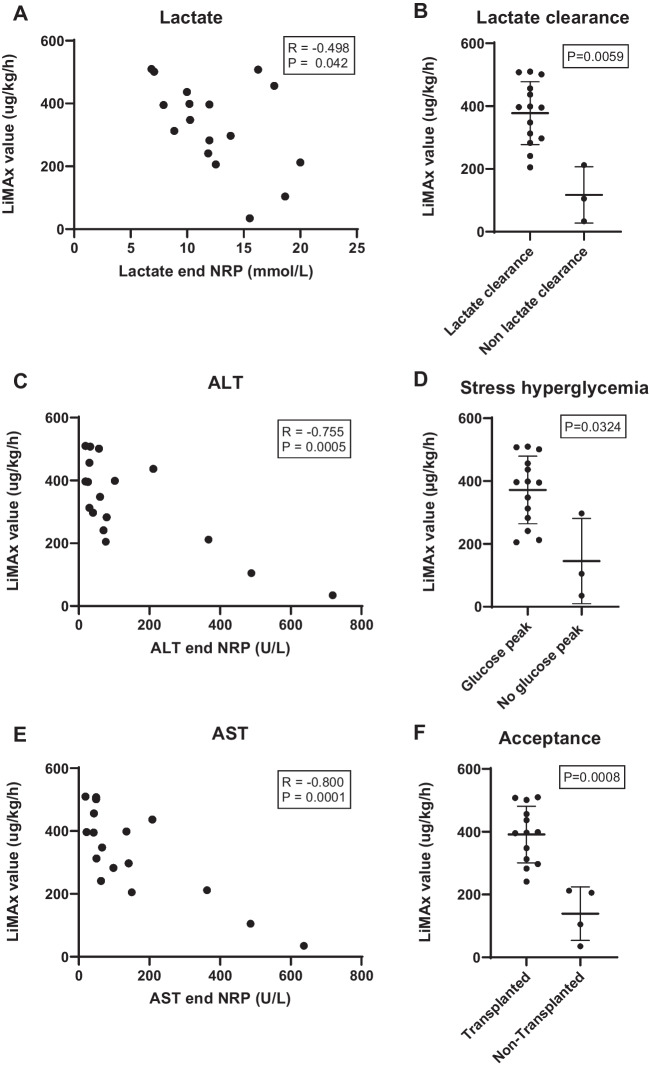
Fig. 4.
The LiMAx score during aNRP is compared to liver parameters (Lactate, ALT, AST, and glucose peak) of aNRP. A shows significant correlation between LiMAx score and lactate levels in the blood at the end of aNRP. B shows the LiMAx score according to dichotomous lactate clearance during aNRP. Donor livers which demonstrated non lactate clearance had a significant lower LiMAx score. C and E demonstrate significant correlation between LiMAx scores and ALT and AST levels in the blood at the end of aNRP. D demonstrates that the livers with a stress glucose peak (> 20 mmol/l) have a higher LiMAx score. F shows that transplanted livers had a higher LiMAx score than non-transplanted livers

