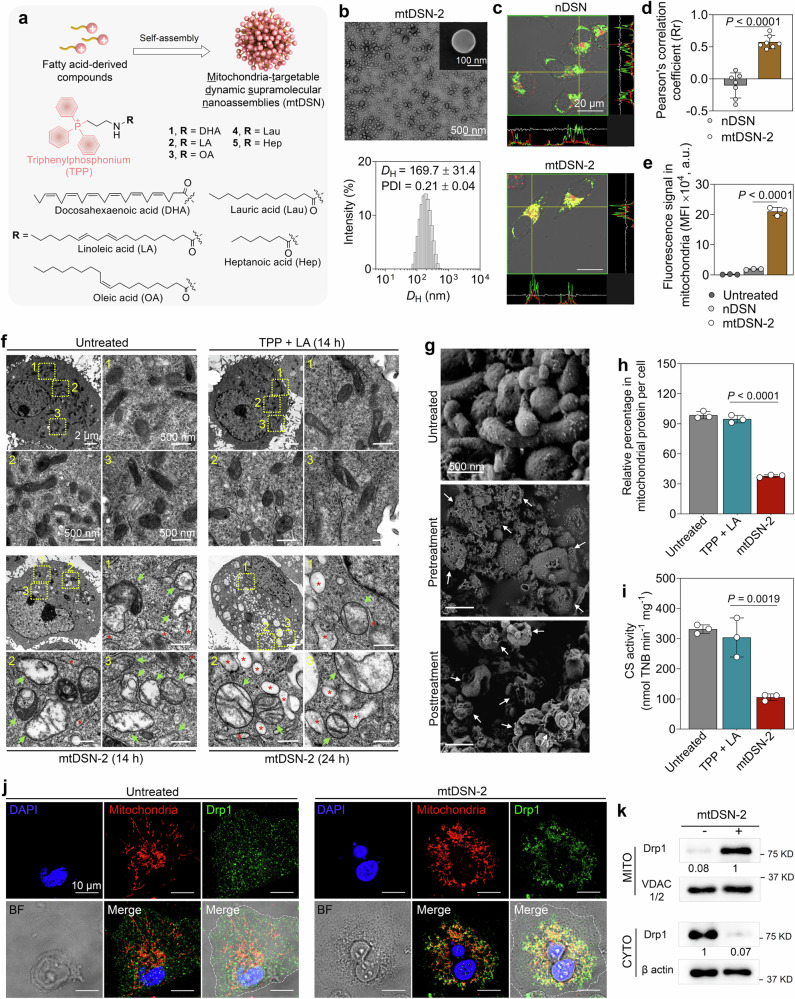
Fig. 1. Mitochondria-targetable dynamic supramolecular nanoassemblies (mtDSN) induce mitochondrial dysfunction.
a Chemical structures of fatty acid-TPP conjugates and schematic of the self-assembly of these small molecules. b Representative TEM image (inset: SEM image) and size distribution of linoleic acid-derived mtDSN (mtDSN-2). DH, hydrodynamic diameter. PDI, polydispersity index. c Confocal microscopy images showing the colocalization of mtDSN-2 with mitochondria upon cellular uptake. The corresponding fluorescence intensity profile analysis of marked positions (yellow crossed lines) is shown on the right and below the images. A nontargetable nanoassembly (nDSN) was included for comparison. Mitochondria: MitoTracker Green (green), DSN: Cy5.5 label (red). d Pearson’s correlation coefficient (Rr) analysis of (c). e Mitochondrial accumulation of dye-labeled nanoassemblies detected by flow cytometry. MFI, mean fluorescence intensity. a.u., arbitrary unit. f TEM images of mitochondrial ultrastructures after different treatments in HeLa/R cancer cells. Green arrows and red asterisks indicate the damaged mitochondria and swelling endoplasmic reticulum, respectively. g SEM images of isolated mitochondria from cancer cells. Pretreatment: cells were pretreated with 5 μM mtDSN-2 for 12 h before mitochondria extraction. Posttreatment: mitochondria were recovered from cells and then incubated with 0.5 μM mtDSN-2 for 30 min at 4 °C. Arrows indicate damaged mitochondria. h Relative protein content in mitochondria per cell in each treatment. i, Citrate synthase (CS) activity in mitochondria after each treatment, determined by measuring the production of 2-nitro-5-thiobenzoic acid (TNB). j Immunofluorescence staining revealed the recruitment of the Drp1 protein to mitochondria in response to mtDSN-2 treatment. Mitochondria: MitoTracker Red CMXRos (red), Drp1: antibody against Drp1 (green), nuclei: DAPI (blue), BF: bright field. k Drp1 levels in mitochondria (MITO) and cytosol (CYTO), assessed by immunoblotting. Band intensities were quantitatively analyzed from the 8-bit digital images by densitometry in ImageJ. The data are presented as the mean ± s.d. n = 3 biologically independent samples (b–c, e–j). Data of seven different views from three biologically independent samples (d). The similar results were repeated in two biologically independent experiments (k). Statistical analysis by Student’s t test (d) or one-way ANOVA with Turkey’s multiple comparisons test (e, h and i). Source data are provided as a Source data file.

