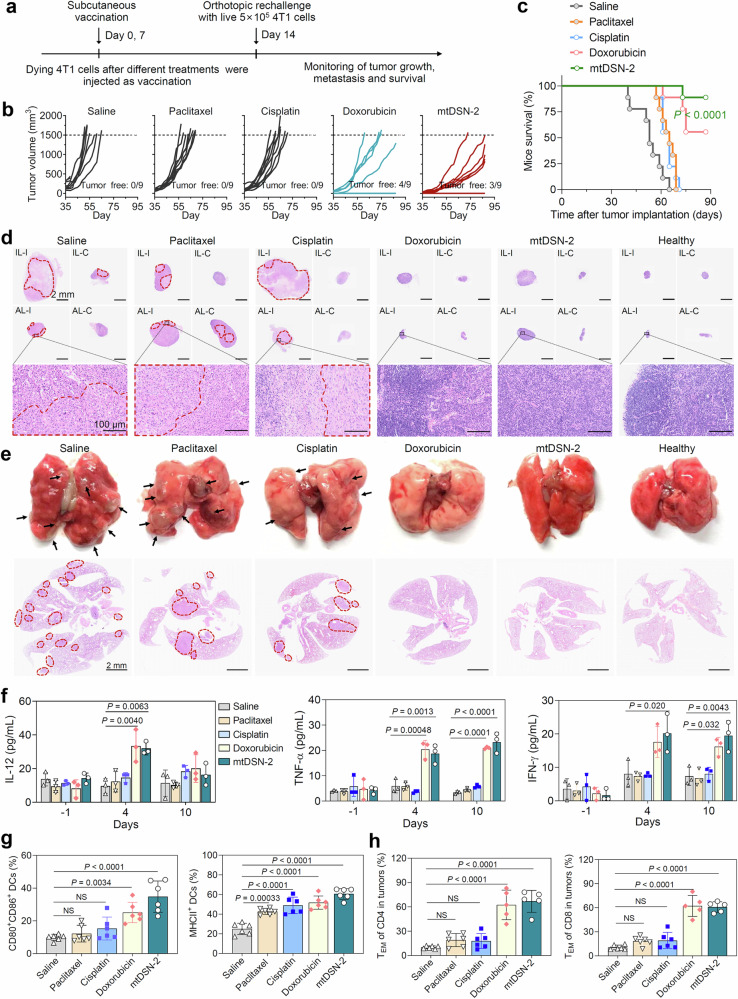
Fig. 4. mtDSN-2 incites tumor immunogenicity against tumor relapse and metastases in vivo.
a Schedule of the prophylactic vaccination model in BALB/c mice to investigate the ICD-induced immunogenicity in vivo. b Individual tumor growth curves in each group (n = 9 mice/group). Mice were sacrificed when tumor volume exceeded 1500 mm3. c Kaplan–Meier survival curves of rechallenged mice after different vaccinations (n = 9 mice/group). P indicates the statistical significance relative to the saline-treated group. Hematoxylin and eosin (H&E) staining revealed tumor metastases to lymph nodes (d) and lungs (e) from mice bearing established 4T1 tumors in each group on day 59. Red dotted regions and black arrows indicate metastasized tumors. IL-I ipsilateral inguinal lymph nodes, IL-C contralateral inguinal lymph nodes, AL-I ipsilateral axillary lymph nodes, AL-C contralateral axillary lymph nodes. n = 3 mice/group. Analysis of immune landscape after vaccination. Levels of IL-12, TNF-α and IFN-γ in the serum of mice on the indicated days (f, n = 3 biologically independent samples); quantitative analyses of mature dendritic cells (CD45+CD11c+CD80+CD86+/MHCII+ dendritic cells) in tumor-draining lymph nodes (g, n = 6 biologically independent samples) and TEM cells (CD45+CD3+CD4/8+CD62L−CD44+) in tumors (h, n = 6 mice for saline, paclitaxel, and cisplatin; n = 5 mice for doxorubicin and mtDSN-2) by flow cytometry. The data are presented as the mean ± s.d. NS: not significant. Statistical analysis by log-rank test (c), one-way ANOVA with Turkey’s (f, g) or Bonferroni’s (h) multiple comparisons test. Source data are provided as a Source data file.

