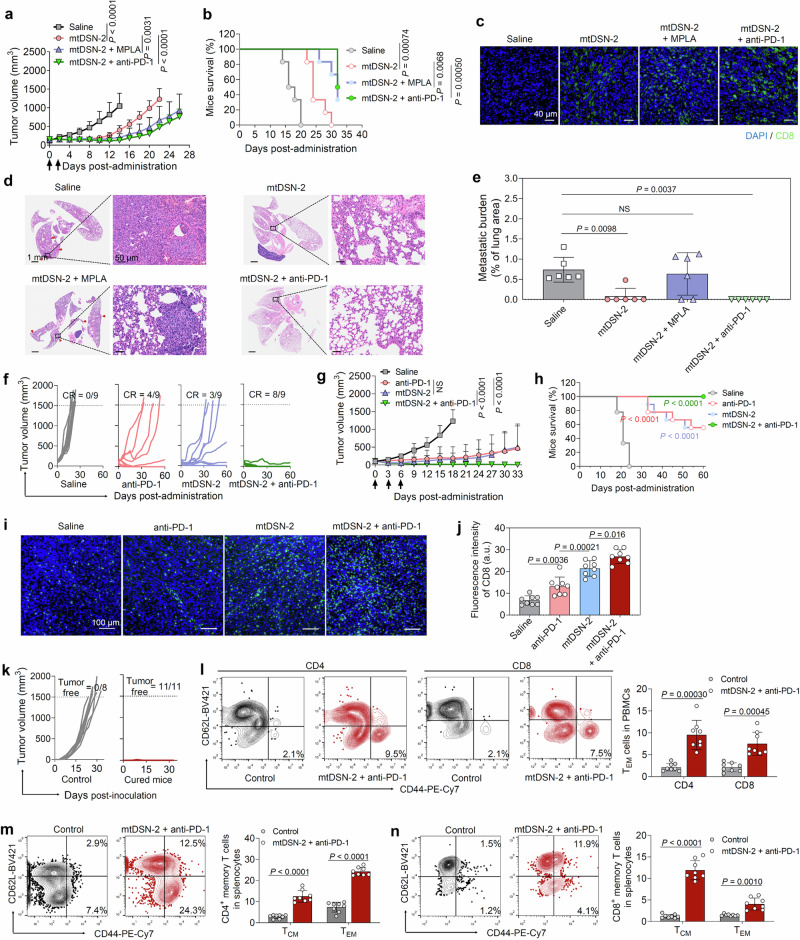
Fig. 6. mtDSN-2 synergizes with immunotherapies against solid tumors.
a Growth kinetics of 4T1 tumors after different treatments (n = 6 mice/group). b Kaplan–Meier survival of 4T1 tumor-bearing BALB/c mice (n = 6 mice/group). c Immunofluorescence staining of the tumor sections showed CD8+ T-cell infiltration. n = 3 mice/group. d H&E staining images of lung tissue sections. Red arrows indicate metastatic foci. The representative images are shown from six independent samples. e Quantification of the metastatic foci in lung tissues (n = 6 mice/group). Mice were sacrificed and lungs were excised for analysis when tumor volume exceeded 1500 mm3 or at the endpoint of the experiment. Individual MC38 tumor growth curves (f) and average tumor growth profiles (g) in each group (n = 9 mice/group). h, Kaplan–Meier survival of MC38 tumor-bearing C57BL/6 mice (n = 9 mice/group). P indicates the statistical significance relative to the saline-treated group. Immunofluorescence staining of the tumors indicated CD8+ T-cell infiltration (i) and the corresponding quantification (j), a.u., arbitrary units. Data of eight different views from 3 biologically independent samples. k Tumor growth curves after tumor rechallenge (n = 8 for healthy control, n = 3 for mtDSN-2, and n = 8 for mtDSN-2 + anti-PD-1 cured mice). Flow cytometry plots and percentages of TEM (CD44+CD62L−) or TCM (CD44+CD62L+) cells in PBMCs (l) and spleens (m, n) from immunized mice on day 33 (n = 8 mice/group). The data are presented as the mean ± s.d. NS: not significant. Statistical analysis by two-way ANOVA with Turkey’s multiple comparisons test (a, g), log-rank test (b, h), one-way ANOVA with Turkey’s multiple comparisons test (e, j), or Student’s t test (l–n). Source data are provided as a Source data file.

