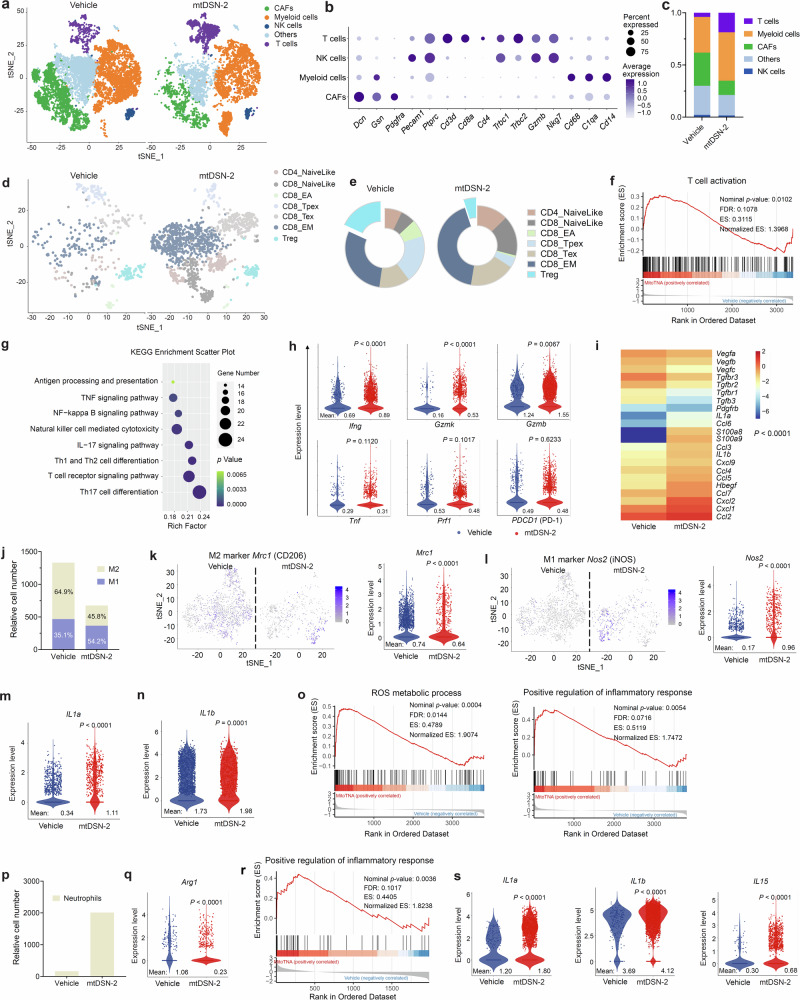
Fig. 8. mtDSN-2 reprograms immunosuppressive TME in MC38 tumors that are refractory to anti-PD-1 immunotherapy.
a t-SNE plots of tumor scRNA-seq data (n = 3 samples were pooled to control for biological variability). CAFs, cancer-associated fibroblasts. b Bubble plot outlines the expression of canonical lineage cell markers used for cell cluster annotation. The percentage expressed in each subset is indicated by the size of the dots, and average expression intensity is indicated by color. c Stacked bar plots show the percentages of the different cell clusters in the two treatment conditions (Vehicle and mtDSN-2) by scRNA-seq. d T cells-only t-SNE projection shows emergent sub-clusters. Supervised T-cell state classification confirms different functional T-cell subsets: naive-like, early activated (EA), progenitor exhausted (Tpex), exhausted (Tex), effector memory (EM) and regulatory T cells (Treg). e Donut chart shows the proportion of T-cell subsets in two treatment conditions. f Gene set enrichment analysis (GSEA) of DEGs showing gene set enrichment associated with cell activation of T cells following mtDSN-2 treatment. FDR, false discovery rate, ES, enrichment score. g Kyoto encyclopedia of genes and genomes (KEGG) pathway enrichment analysis of DEGs showing pathways associated with antitumor response of T cells. h Violin plots represent the expression of activation and cytotoxicity markers in the T-cell subset. i Heat map of representative DEGs in CAFs. j Stacked bar plot showing the proportion of M1 and M2-like clusters in macrophages. k, l t-SNE projection of macrophages reveals Mrc1 (CD206) and Nos2 (iNOS) single-cell transcripts that are clustered in the high-dimensional space in two treatment conditions and then quantified with violin plot. m, n Violin plots represent the expression of IL1a and IL1b in the macrophage subset. o GSEA of DEGs showing gene set enrichment associated with ROS production and proinflammation in macrophages following mtDSN-2 treatment. p Increased neutrophils recruitment following mtDSN-2 treatment. q Violin plot representing the expression of the Arg1 gene in the neutrophil subset. r GSEA of DEGs showing gene set enrichment associated with proinflammation in neutrophils following mtDSN-2 treatment. s Violin plots representing the expression of indicated genes in the neutrophil subset. Statistical analysis by permutation test (f, o and r) and Wilcoxon rank sum test (h, k–n, q and s). Source data are provided as a Source data file.

