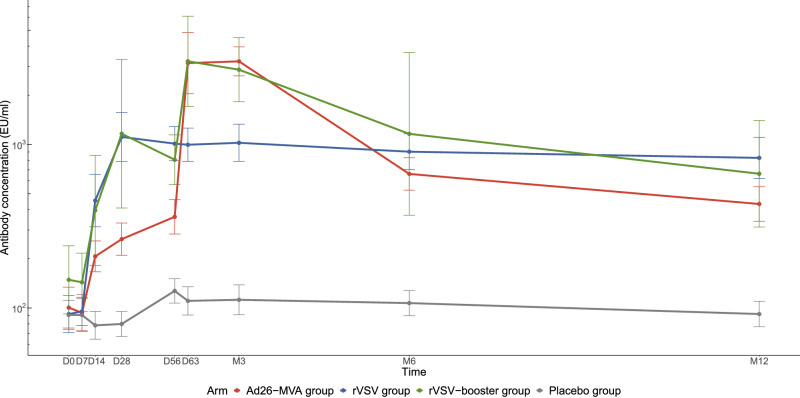
Fig. 2. EBOV-GP antibody response induced by the three vaccine strategies up to months 12 after vaccination.
The geometric mean concentration was based on the log10 concentration with the baseline log10 titer and trial site as covariates. An antibody response was measured by FANG ELISA and defined as an antibody concentration of at least 200 enzyme-linked immunosorbent assay units (EU) per milliliter and an increase from baseline in the antibody concentration by at least a factor of 4. The geometric mean concentrations are shown for placebo (grey) n = 29; Ad26-MVA (red) n = 28; rVSV (blue) n = 27; rVSV-booster group (green) n = 9, respectively. The bars indicate 95% confidence intervals. Source data are provided as a Source Data file.

