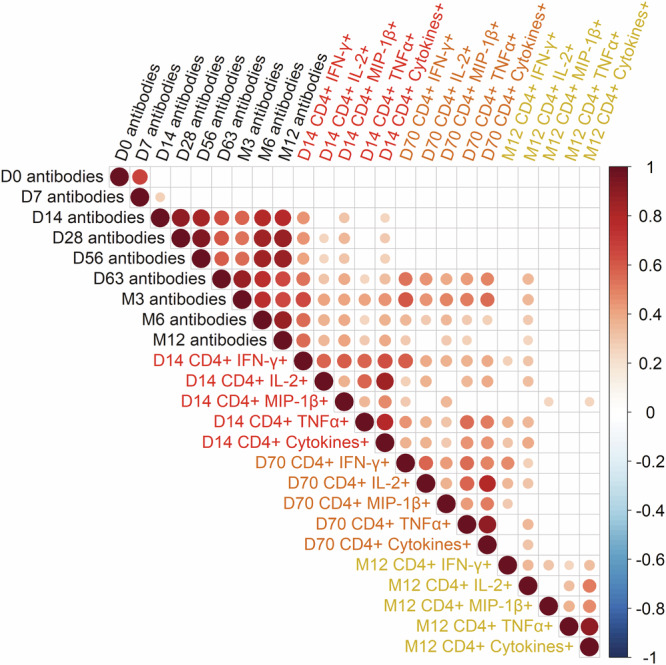
Fig. 4. Correlation between antibody and T-cell responses.

Spearman’s correlation matrix between EBOV-GP antibody and CD4+ T-cell responses from day 0 to month 12 after vaccination in all vaccinated individuals. Correlation analyzes were performed using Spearman’s rank correlation with the two-tailed P-value. A FDR method (Benjamini-Hochberg) was used to adjust for test multiplicity. Colors indicate Spearman’s correlation coefficient. Only significant correlations after adjustment for test multiplicity (p < 0.05) are represented. Source data are provided as a Source Data file.
