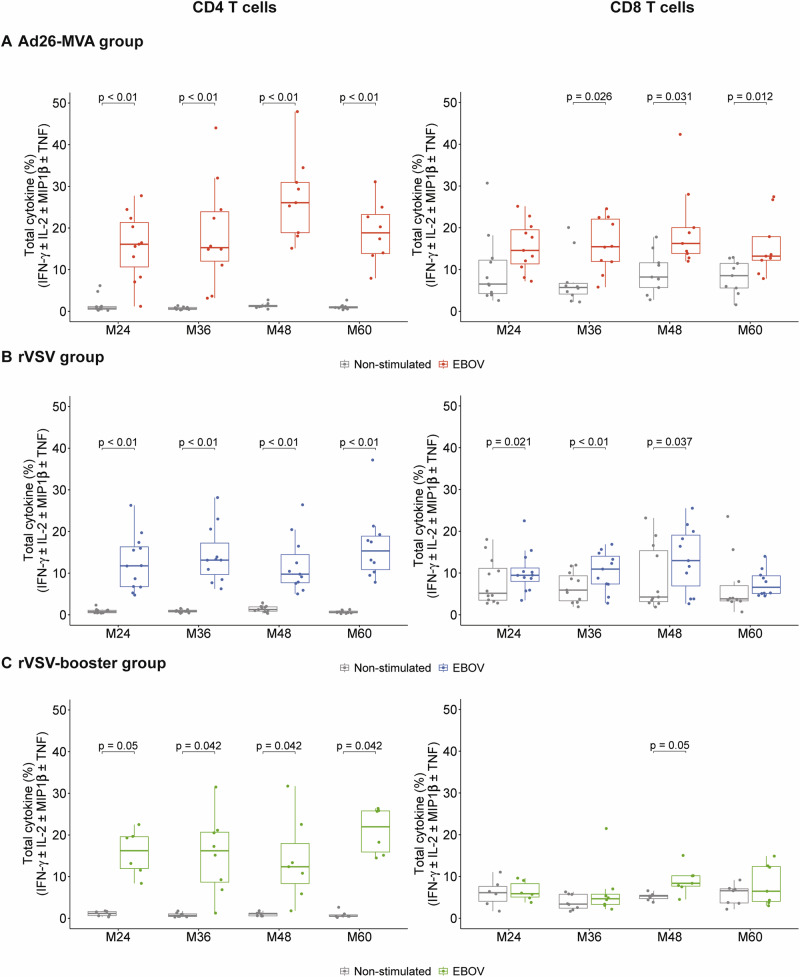
Fig. 5. Characterization of EBOV-specific T-cell responses induced by the three vaccine strategies at months (M)24, M36, M48, and M60 after vaccination.
Total cytokine (IFN-γ ± IL-2 ± MIP1β ± TNF) levels (sum of the Boolean gates) produced by EBOV-specific CD4+ or CD8+ T cells from individuals in the Ad26-MVA (A), rVSV (B), and rVSV-booster (C) groups following in vitro stimulation on D0 and re-stimulation on D8 with the EBOV peptide pools (1 µg/mL of each) at M24 (n = 11 Ad26-MVA, n = 12 rVSV, n = 6 rVSV-booster), M36 (n = 10 Ad26-MVA, n = 11 rVSV, n = 8 rVSV-booster), M48 (n = 9 Ad26-MVA, n = 11 rVSV, n = 7 rVSV-booster), and M60 (n = 9 Ad26-MVA, n = 10 rVSV, n = 7 rVSV-booster) post-vaccination. The median values ± IQRs are shown. The box plots display the median (central line), the first and third quartiles (boxes), and the whiskers show 1.5 fold the interquartile range (IQR) above and below the boxes. Each dot represents an individual value of total cytokine. Two-sided Wilcoxon signed-rank test was used for comparisons between stimulated and unstimulated responses. FDR method (Benjamini-Hochberg) was used to adjust for test multiplicity for each arm comparison separately. The exact p-values for CD4 T cells in Ad26-MVA group at M24, M36, M48 and M60 in the comparison between the unstimulated condition (grey) and stimulated condition (red) are p = 0.008, for all time points. The exact p-values for CD4 T cells in the rVSV group at M24, M36, M48 and M60 comparing the unstimulated condition (grey) and stimulated condition (blue) are p = 0.002 from M24 to M48 and p = 0.003 for M60. The exact p-value for CD8 T cells at M36 is p = 0.002. Source data are provided as a Source Data file.

