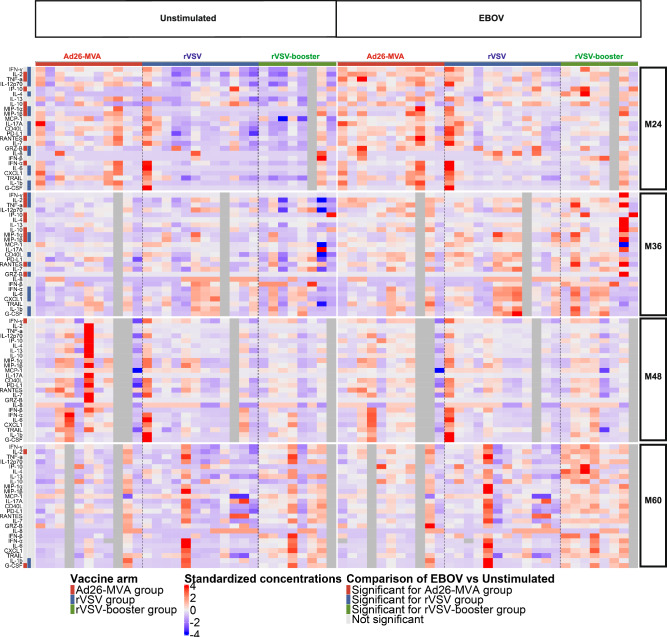
Fig. 7. Standardized biomarker expression in culture supernatants induced by EBOV peptide pools at months (M)24, M36, M48, and M60 after vaccination.
Heatmap of supernatants from the PBMCs of vaccinated individuals at M24, M36, M48, and M60 after prime vaccination collected on day 2 after stimulation with EBOV peptide pools (sum of EBOV1 and EBOV2 peptide pools). The colors represent standardized expression values centered around the mean, with a variance equal to 1 for each cytokine and time point. The Wilcoxon U test for paired samples was used for comparisons between EBOV peptide pools and unstimulated responses for each vaccine strategy and time point. Significant differences are represented by colors according to the vaccine strategy. Grey columns represent missing data, when participants were not sampled at the specified time point. Source data are provided as a Source Data file.

