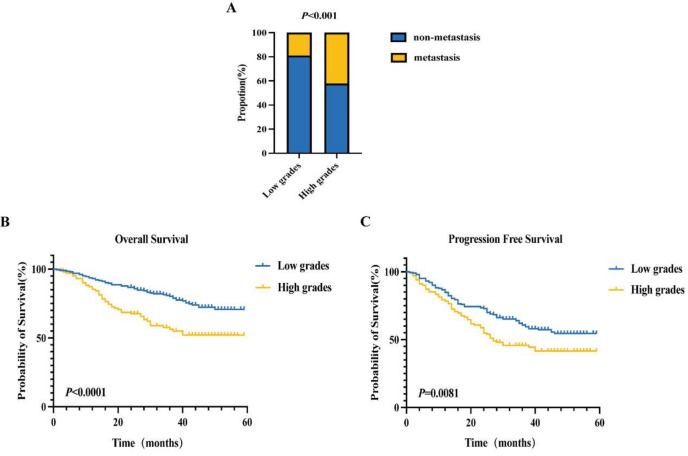
Figure 4.
Comparison of the occurrence of distant metastases and OS and PFS survival curves between the two groups of patients. (A) The disparity in distant metastasis between the low and high subgroups exhibits statistical significance (P < 0.001). (B) The mean OS for the low subgroup is 49 months, contrasting with 40 months for the high subgroup, both statistically significant (P < 0.05). (C) The mean PFS in the low subgroup spans 41 months, while the median PFS in the high subgroup stands at 27 months, both showing statistical significance (P < 0.05).

