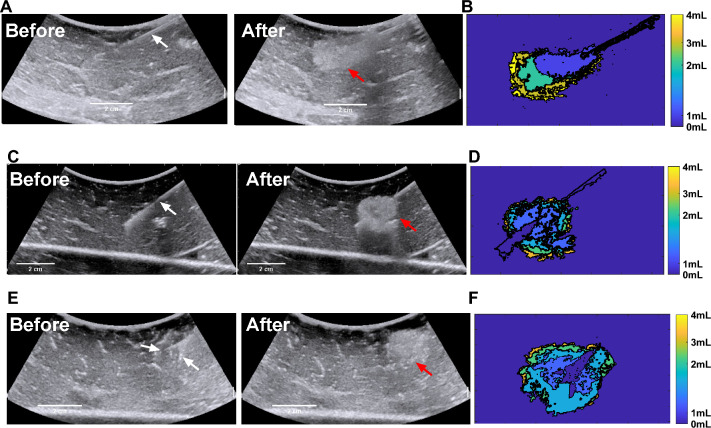
Fig.3.
Representative spatiotemporal US images during injection of 4 mL POL containing 0.01% v/v MB at 100 mL/hr. US before injection with the needle (white arrows) in place, gel after injection (red arrows) with the needle removed, and rendering of incremental areas for cumulative injected volumes at 1, 2, 3, and 4 mL for SEHN (A and B), MSHN (C and D) and MPIN -1 cm (E and F). MPIN-1 cm US (E) images before injection show the main needle and a deployed prong.(white arrows), and injected volume (red arrow). .

