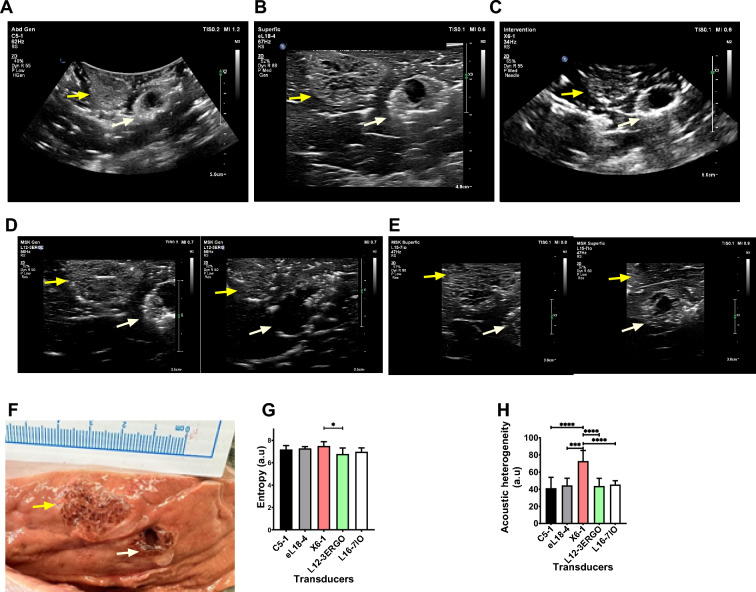
Fig.6.
Evaluation of US imageability using 5 transducers. B-mode image of two adjacent 4 mL POL injections (yellow and white arrows) using (A) C5-1, (B) El18-4, and (C) X6-1 transducers. B-mode US images of the same adjacent injections with L12-3ERGO transducer (D, right, and left) and L16-7IO (E, right, and left). (F) Gross pathology of two 4 mL injected POL. (G) Entropy of the B-mode US images for 5 transducers and (H) corresponding acoustic heterogeneities. *p < 0.05, ***p < 0.001, ****p < 0.0001 from one-way ANOVA statistical test. Error bars represent standard deviations for n = 3 average.

