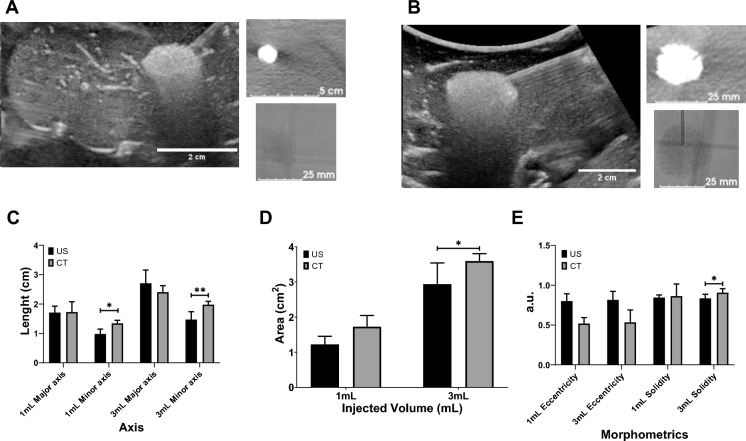
Fig.8.
US and x-ray imageability of POL. (A) 1 mL of POL injected in ex vivo liver with US (left), CT (upper right), and fluoroscopic (lower right) images. (B) 3 mL of POL injected in ex vivo liver with US (left), CT (upper right), and fluoroscopic (lower right) images. (C) Length (cm) of major (equatorial) and minor (meridian) axes of 1 mL and 3 mL injected POL in ex vivo liver based on US and CT images. (D) Area (cm2) of 1 mL and 3 mL injected POL in ex vivo liver from US and CT images. (E) Eccentricity (a.u.) of 1 mL and 3 mL injected POL in ex vivo tissue from US and CT images. *p < 0.05, **p < 0.01 from t-test statistical analysis. Error bars represent standard deviations for n = 3 average.

