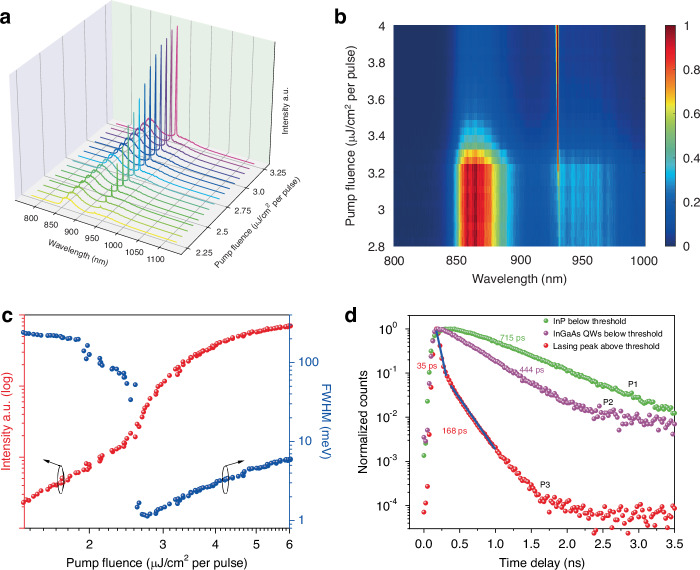
Fig. 2. Lasing characterization of a single on-substrate NW.
a Emission spectrum at different pump fluences. b Normalized emission intensity spectral map as a function of pump fluence. c Lasing emission intensity (red) and the corresponding FWHM of the spectrum (blue) as a function of pump fluence plotted on a logarithmic-logarithmic scale. d Normalized time-resolved emission decays from the InP, InGaAs QWs and lasing peak at different pump fluences

