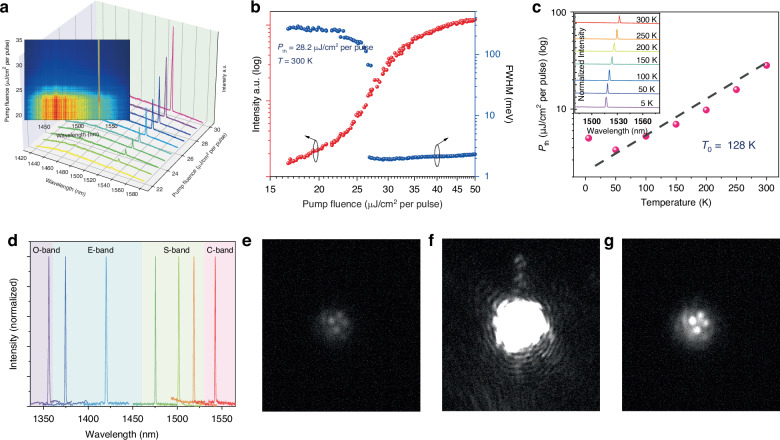
Fig. 4. Telecom-band lasing characterization.
a Emission spectra at different pump fluences of a single standing NW. Inset shows the corresponding normalized spectral intensity map. b Emission intensity (red) and the corresponding FWHM (blue) of the spectra as a function of pump fluence. c Lasing threshold versus operation temperature. The dashed line is a fitting of the experimental data to extract the characteristic temperature. Inset shows the lasing spectrum at various temperatures. d Telecom-band lasing spectra from NWs with different indium compositions in the QWs at room temperature under a pump fluence of 1.3 Pth. e, f Optical images from the NW array before (e), and after (f) lasing threshold. g Image on (f) under an attenuated pump fluence

