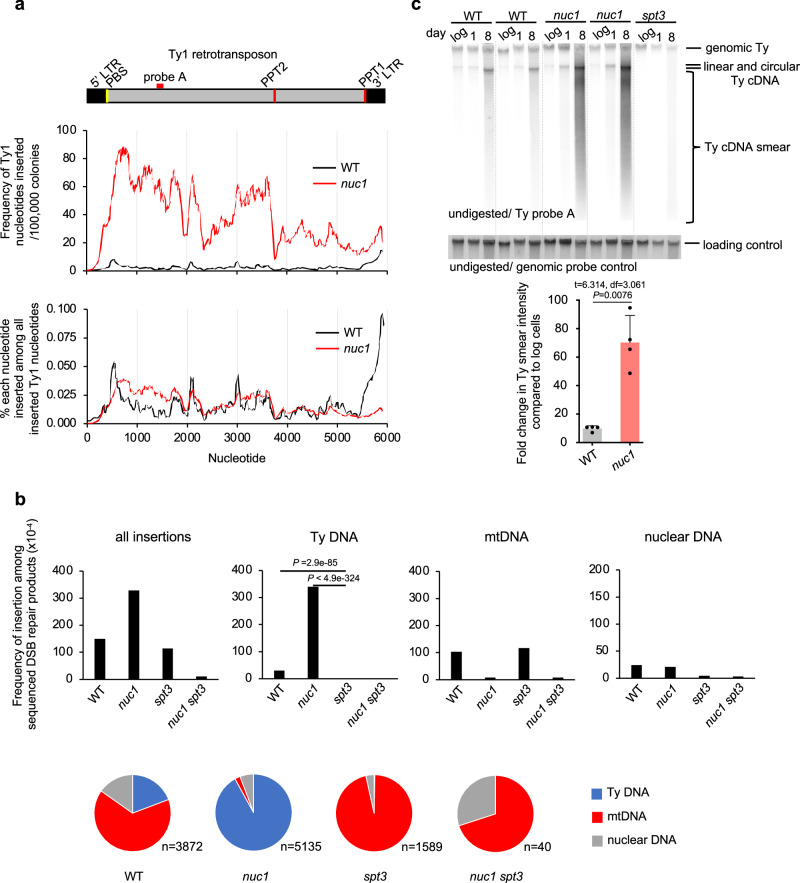
Fig. 5. Nuc1 degrades retrotransposon cDNA replication intermediates.
a Analysis of Ty1 sequences inserted at DSBs in wild-type and nuc1Δ cells. Frequency of each Ty1 nucleotide insertion per 106 NHEJ products or among all Ty1 nucleotides inserted. Schematic of Ty1 shown at top indicating long terminal repeats (LTR), primer binding site (PBS) and polypurine tracts (PPT1/2). b Frequency and types of DNA inserted at DSBs in wild-type, nuc1Δ, spt3Δ, and nuc1Δ spt3Δ mutant cells in 8 days stationary phase cells. Pie charts below demonstrate distribution of different insertion donor DNA. n represents number of inserted DNA. P values were determined using two-tailed χ2 test. n–number of NHEJ products tested is shown in Supplementary Data 1. c Southern blot analysis of Ty1 cDNA in wild-type, nuc1Δ and control spt3Δ cells. Quantification of Ty1 cDNA smear is shown (mean ± SD; n = 4; n represents biological repeats. P values were determined using unpaired two-tailed Welch’s t-test). The position of the probe used is shown in (a). Source data are provided as a Source Data file.

