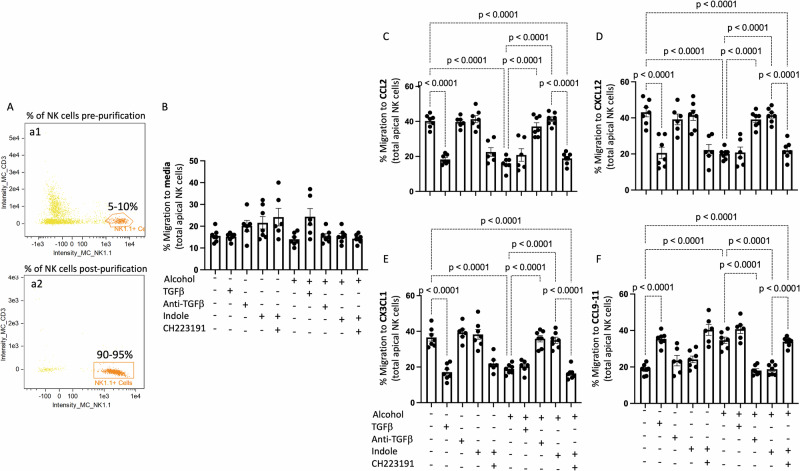
Fig. 9. Alcohol dysregulates NK cell migration in response to chemokines.
Mouse primary splenic NK cells were collected from alcohol-fed and treated mice and added to the apical side of a Transwell and migration in response to different chemokines was assessed following 5 h of incubation. A Confirmation of NK cell purification. (a1) Percentage of NK cells pre-isolation, and (a2) percentage of NK cells post-isolation. NK cell migration response profiles to (B) medial alone, (C) CCL2, (D) CXCL12, (E) CX3CL1, and (F) CCL9-11. Percent migration was calculated as the total number of viable NK cells in the bottom well divided by the total number of viable NK cells added to the Transwell insert. p values are indicated in the figure by one‐way ANOVA with Sidak’s multiple comparison. N = 6–7 wells of primary NK cells/group (12–14 mice/group, NK cells per 2 mice were pooled) derived from 2 independent experiments.

