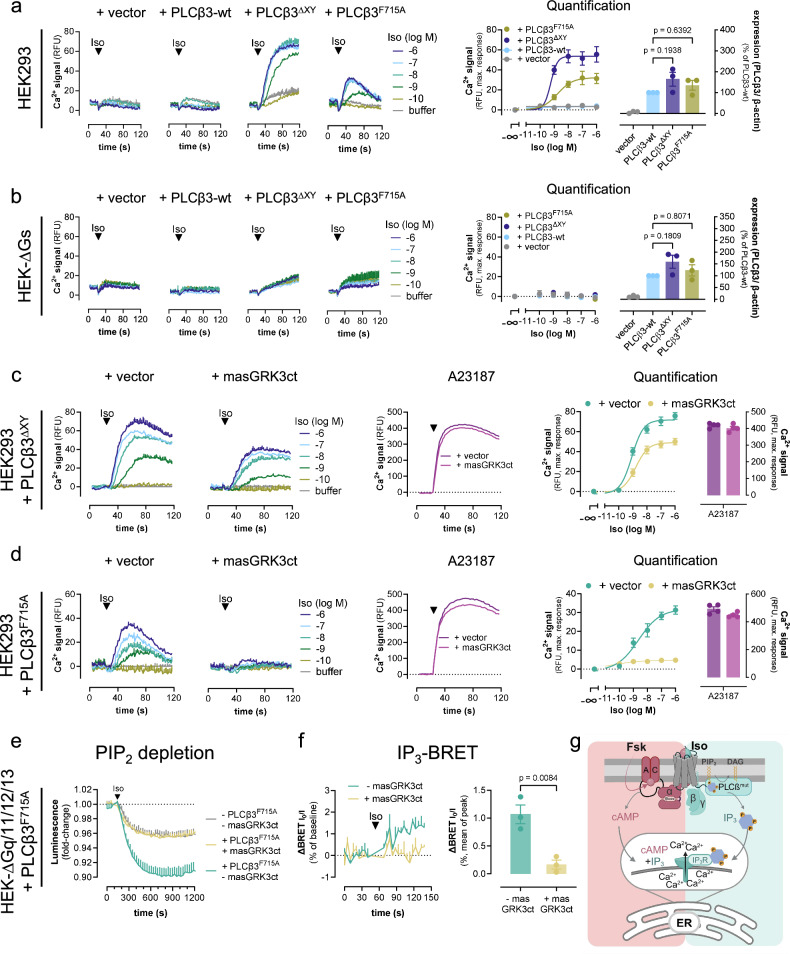
Fig. 9. PLCβ3 variants with disabled autoinhibition empower Iso-mediated Gs-βγ-Ca2+ without Gq priming.
a, b Representative Ca2+ traces and corresponding quantification of maximum Ca2+ amplitudes in HEK293 (a) and HEK-ΔGs (b) cells transfected with either empty vector DNA or cDNA plasmids coding for PLCβ3-wt, PLCβ3ΔXY or PLCβ3F715A upon Iso stimulation. Rightmost panels: Western blot quantification of each PLCβ variant. The statistical significance of expression level differences was determined using a one-way ANOVA with Tukey´s post-hoc analysis. c, d Naive HEK293 cells were transfected to express either PLCβ3ΔXY (c) or PLCβ3F715A (d) in the absence (vector) or presence of the Gβγ scavenger masGRK3ct. e Iso-induced PIP2 depletion in HEK-ΔGq/11/12/13 cells transfected to express the PIP2 hydrolysis NanoBiT-based biosensor along with PLCβF715A, β2AR, and masGRK3ct or empty vector DNA as control. f IP3 BRET recordings and corresponding quantification in HEK-ΔGq/11/12/13 cells, transfected to express the IP3-BRET sensor along with PLCβF715A in the absence (empty vector) or presence of masGRK3ct upon addition of Iso or buffer. g Cartoon representation depicting the cellular consequences of cAMP production as well as IP3 formation on mobilization of cytosolic Ca2+ from ER sources. cAMP and IP3 synergize to sensitize ER-localized IP3R channels for mobilization of cytosolic Ca2+. Mutant PLCβ3 variants with crippled autoinhibition produce IP3 without Gq priming in response to Gβγ only. PLCβmut = PLCβ3ΔXY, or PLCβ3F715A. Cells in a–d were FR-pretreated (1 µM) to exclude any potential Gq contribution. Representative Ca2+ recordings in a–d are shown as mean + SEM, summarized data are mean ± SEM of n independent biological replicates (a, b: n = 3; c, d: n = 4), each performed in duplicate. PIP2 depletion data (e) are mean + SEM of n = 3 experiments, each performed in duplicate. BRET IP3 real-time recordings (f) are depicted as mean + SEM of n = 3 experiments, one performed in triplicate and two in nonuplicate; their summarized data are shown as mean ± SEM; statistical significance was determined using a two-tailed student’s t test. Source data are provided as a Source Data file. g was created with BioRender.com released under a Creative Commons Attribution-NonCommercial-NoDerivs 4.0 International license https://creativecommons.org/licenses/by-nc-nd/4.0/deed.en”.

