
Figure 11.
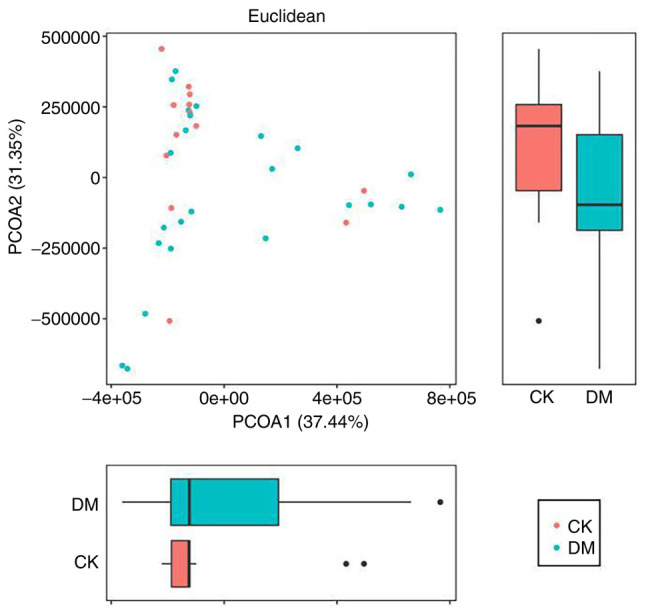
Principal coordinates analysis graph. The horizontal and vertical coordinates indicate the first and second principal coordinates, respectively; the percentages indicate the contribution of the corresponding principal coordinates to the difference between the samples; the P-value indicates the degree of difference between the two groups in the corresponding principal coordinates; the dots indicate the individual samples and the different colors indicate that the samples belong to different groups; the horizontal box plot is the distribution of the values of different groups in the first principal coordinate; the vertical box plot is the distribution of the values of different groups in the second principal coordinate.