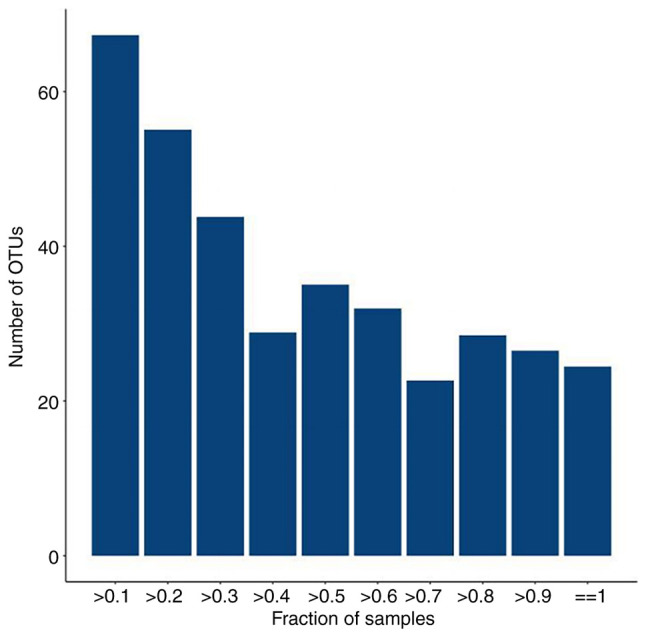
Figure 5.

Plot of total number of OTUs vs. number of samples, The horizontal coordinate is the proportion of samples covered and the vertical coordinate is the number of total OTUs with a statistical coverage greater than this proportion of samples, which is represented in the figure as the number of OTUs for samples above a certain proportion of coverage. OUT, operational taxonomic unit.
