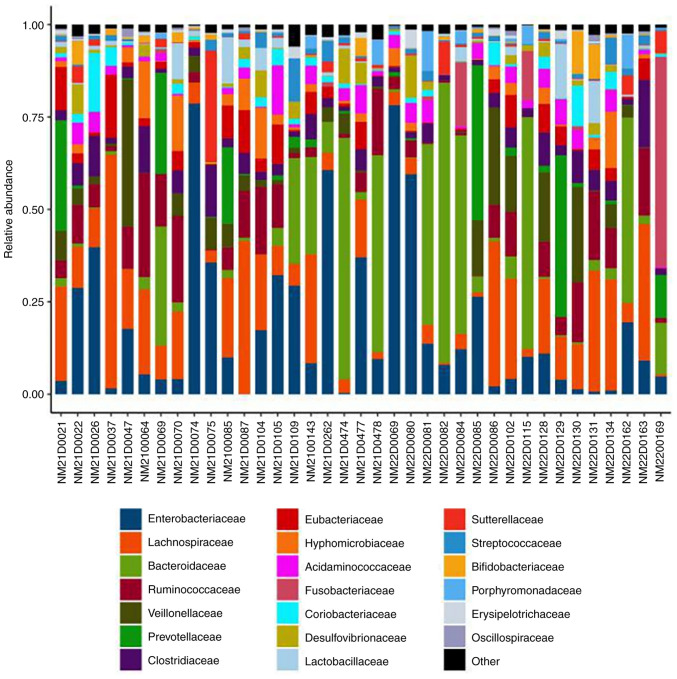
Figure 7.
Species profiling histograms for samples at different taxonomic levels. The horizontal coordinate is the name of the sample and the vertical coordinate is the relative abundance of the species. Different colors correspond to different species and the length of the color block indicates the relative abundance of the species represented by that color.

