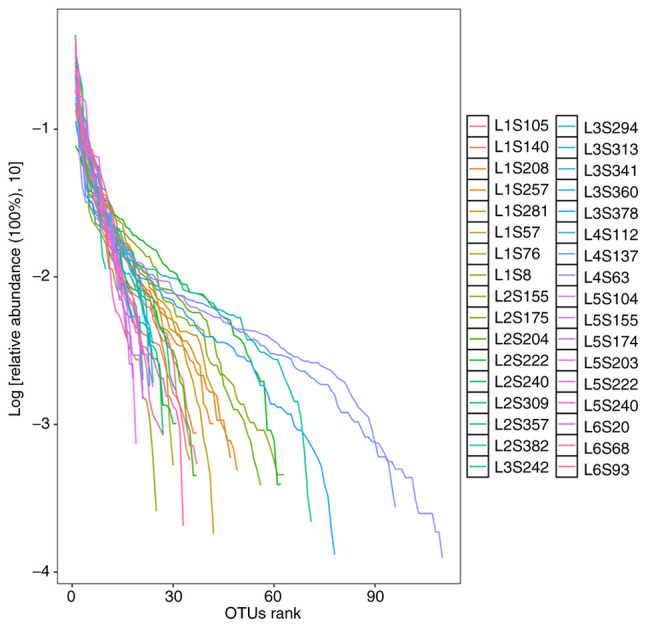
Figure 9.

Sample sequencing depth α diversity sparse plot. The horizontal coordinate represents the number of reads extracted and the vertical coordinate represents the corresponding α diversity index value. Different colors in the graph represent different groups of samples. When the number of sequencing strips cannot cover the samples, the curve rises; when the number of sequencing strips increases to cover most of the microorganisms in the samples, the curve shows a flat trend.
