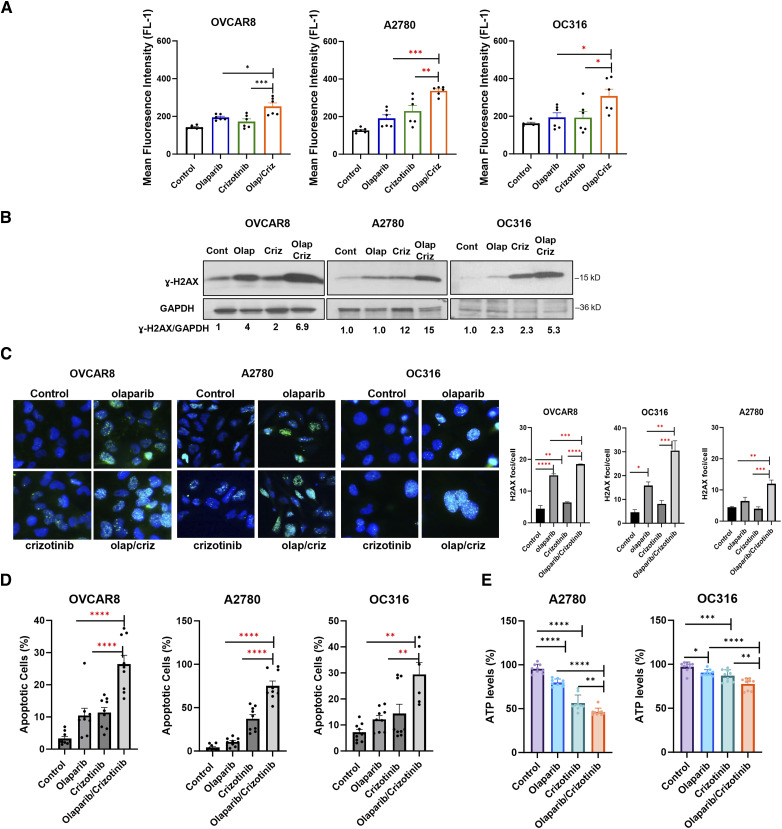
Figure 4.
Combination of olaparib and crizotinib induces ROS, DNA damage and apoptosis in ovarian cancer cells. A, ROS formation was evaluated by plating cells treated with olaparib (5 µmol/L) and crizotinib (1 µmol/L) for 48 hours in triplicate in six-well paltes. Cells were then stained with 5 mmol/L H2DCFDA, collected, and analyzed by flow cytometry after a 30-minute incubation. ROS formation is represented as Mean fluorescence intensity. The data represent the mean of two independent experiments with three replicates. Statistical analysis was conducted using one-way ANOVA. *, P < 0.05; **, P < 0.01; ***, P < 0.001. Error bars represent mean ± SEM. B and C, Evaluation of ɣ-H2AX by Western blot analysis (B) and fluorescence staining (green dots; C). Cancer cells were treated with olaparib (5 µmol/L), crizotinib (1 µmol/L) of both for 5 days. D, Cells were labeled with PI/Annexin V-FITC and analyzed for apoptosis using flow cytometry. Error bars represent means ± SEM. E, Measurement of ATP levels in A2780 and OC316 cells. Cells were treated with olaparib and/or crizotinib, and ATP levels were measured after 24 hours treatment, using ATP Detection Assay-Luminescence from Cayman Chemical. Data include means of three independent experiments with three replicates. Results were obtained using one-way ANOVA. *, P < 0.05; **, P < 0.01; ***, P < 0.001; ****, P < 0.0001. Error bars represent mean ± SD.

