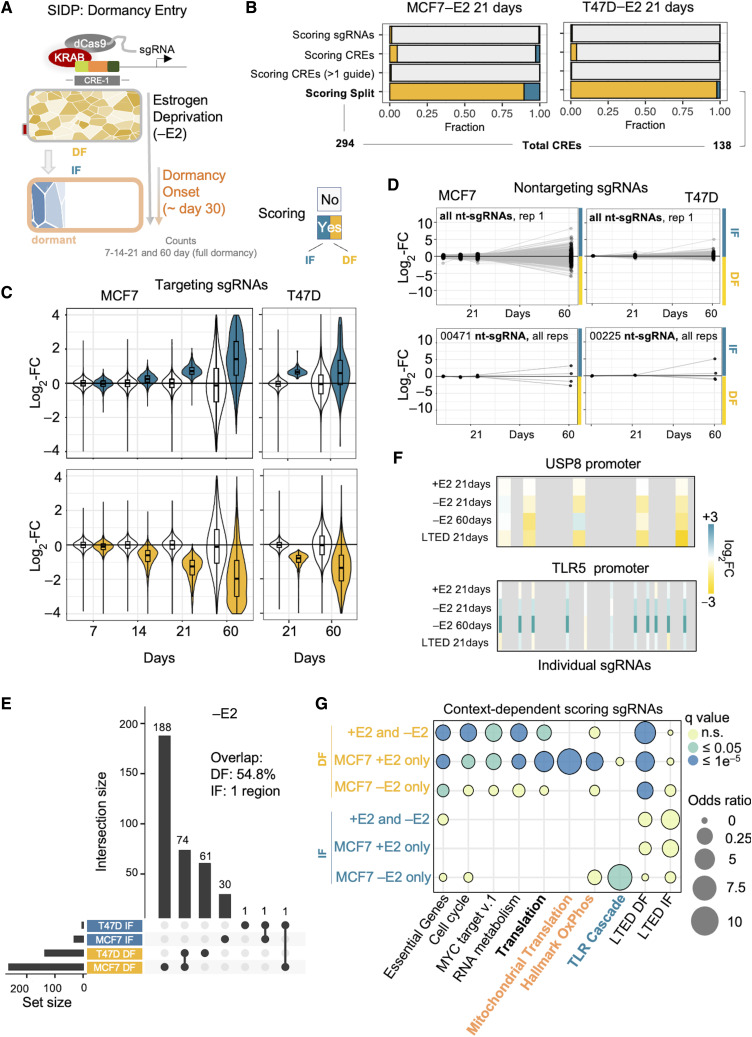
Figure 2.
Adaptation to treatment exposes hidden roles for the noncoding genome. A, Experimental design. B, Bar plot showing the relative fraction of scoring sgRNAs and CREs bearing these sgRNAs, upon perturbation of the noncoding genome of estrogen deprived MCF7 cells via SIDP. Scoring sgRNAs showing a significantly decreased frequency at 21 days postinfection are referred to as DF, whereas those with a significantly higher frequency as IF. For the total numbers of sgRNAs and CREs, refer to Fig. 1B. C, Box plots showing the log2 fold change of both scoring (either blue or yellow) and nonscoring (white) sgRNAs at 21 days postinfection in estrogen-deprived MCF7 cells, at 7, 14, and 21 days, as compared with the initial library. D, Longitudinal tracking of individual non-targeting sgRNAs in four replicates during dormancy entrance (black dots highlight 7, 14, 21, and 60 days postinfection) support stochastic behavior of cells during dormancy entrance. E, UpSet plot showing the intersection between the SIDP loci showing two or more concordant significant sgRNAs after 21 days postinfection, in either MCF7 or T47D cells (−E2). F, Summary of the results for the sgRNAs targeting critical CREs of the USP8 and TLR5 genes. G, Bubble plot highlighting the enrichment of distinct biological functions, when considering sets of genes near CREs showing context-specific responses to perturbation.

