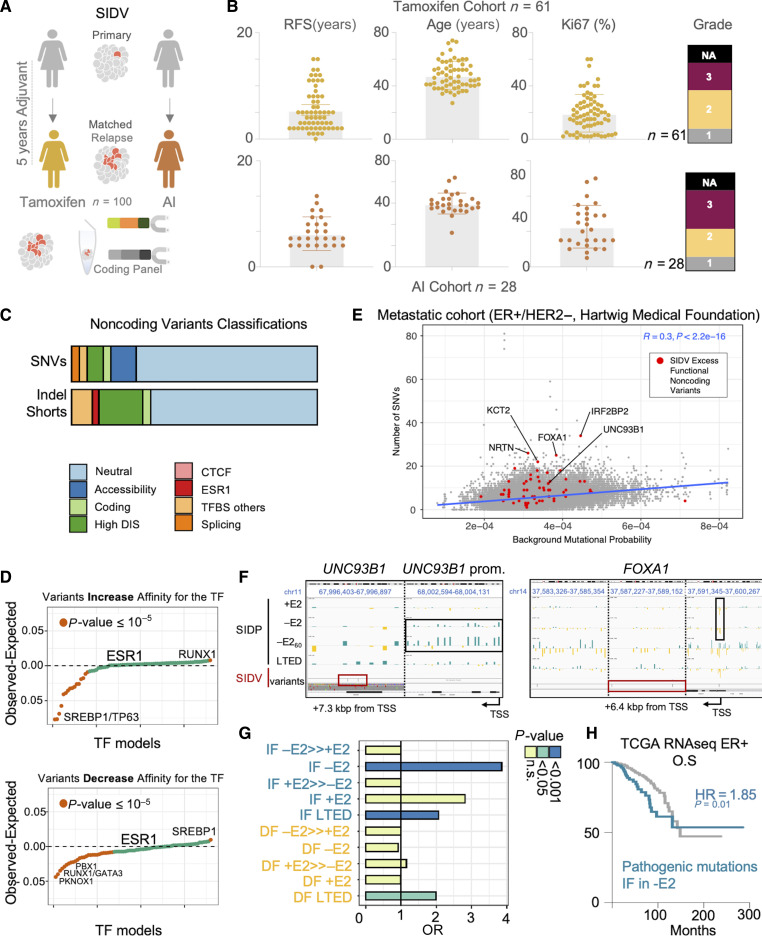
Figure 4.
Noncoding variants contribute to heritable transcriptional changes during tumor progression. A, Schematic showing the rationale and implementation of SIDV. B, Overview of the clinical cohorts and the associated features. C, Pathogenic classification of noncoding variants identified by SIDV. D, Scatterplot summarizing the potential of the profiled SIDV variants to alter transcription factor binding. Each dot represents a TF. TFs are sorted based on their propensity to either increase (top) or decrease (bottom) the affinity to each TF. Values significantly larger than zero indicate a propensity to alter the binding that is higher than expected by chance. Those significantly smaller instead indicate a depletion of variants potentially altering the affinity for a given TF. P values estimated via χ2 test. E, Scatterplot showing the number of SNVs in the SID regions (each dot is a region) across 551 ER-positive, HER2-negative metastatic breast cancer samples, vs. the estimated background mutational rate. Regions showing an excess of functional variants are highlighted in red. The blue line represents a linear fit of the data. F, Integration of SIDV and SIDP identify critical regulators of HDBC biology. SIDP log2 fold changes (for the indicated samples, in black; blue fold changes indicate an increased frequency compared with the control library, yellow ones indicate a decrease; scale is [−3; +3]) and SIDV calls (in dark red) at the indicated loci are shown (IGV genome browser). Dark red and black boxes indicate regions with clusters of mutations or with multiple scoring sgRNAs, respectively. For both loci, different zoomed-in regions are shown, separate by vertical, black, dashed lines (precise coordinates of each region are indicated on top). G, Bar plot showing enrichment of SIDV-identified alterations at sets of regions showing condition-specific patterns upon perturbation (SIDP). P values estimated via χ2 Test. H, Kaplan–Meier plot showing that genes near CREs with an excess of SIDV mutations and overlapping IF sgRNAs upon estrogen deprivation (−E2) are associated with prognostic expression levels (HR = 1.85, P value = 0.01; log-rank Test).

