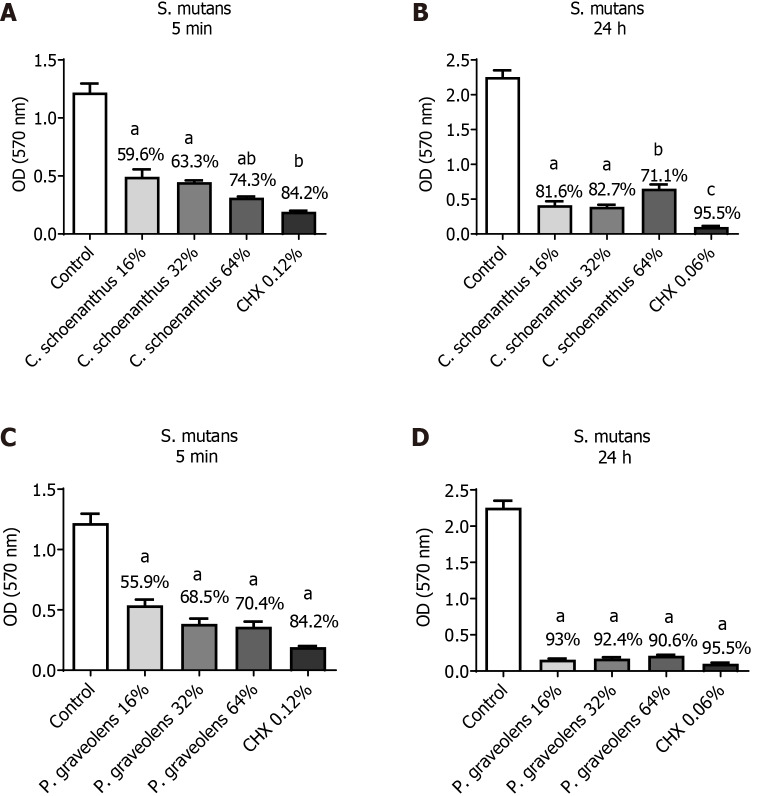
Figure 1.
Reduction of Streptococcus mutans monotipic biofilm (in %) calculated using the MTT test after treatment with experimental groups. Data are presented as the mean ± standard deviation. Statistical analysis was performed using one-way analysis of variance with Tukey’s post-hoc test (n = 10, α = 0.05). Statistical significance is indicated as follows: aP ≤ 0.0001 vs the control group, bP < 0.0025 vs Cymbopogon schoenanthus 32%, and cP < 0.0001 vs C. schoenanthus 64%. A: Streptococcus mutans biofilm treated for 5 min with C. schoenanthus at various concentrations; B: S. mutans biofilm treated for 24 h with C. schoenanthus at various concentrations; C: S. mutans biofilm treated for 5 min with Pelargonium graveolens at various concentrations; D: S. mutans biofilm treated for 24 h with P. graveolens at various concentrations.

