
Figure 1.
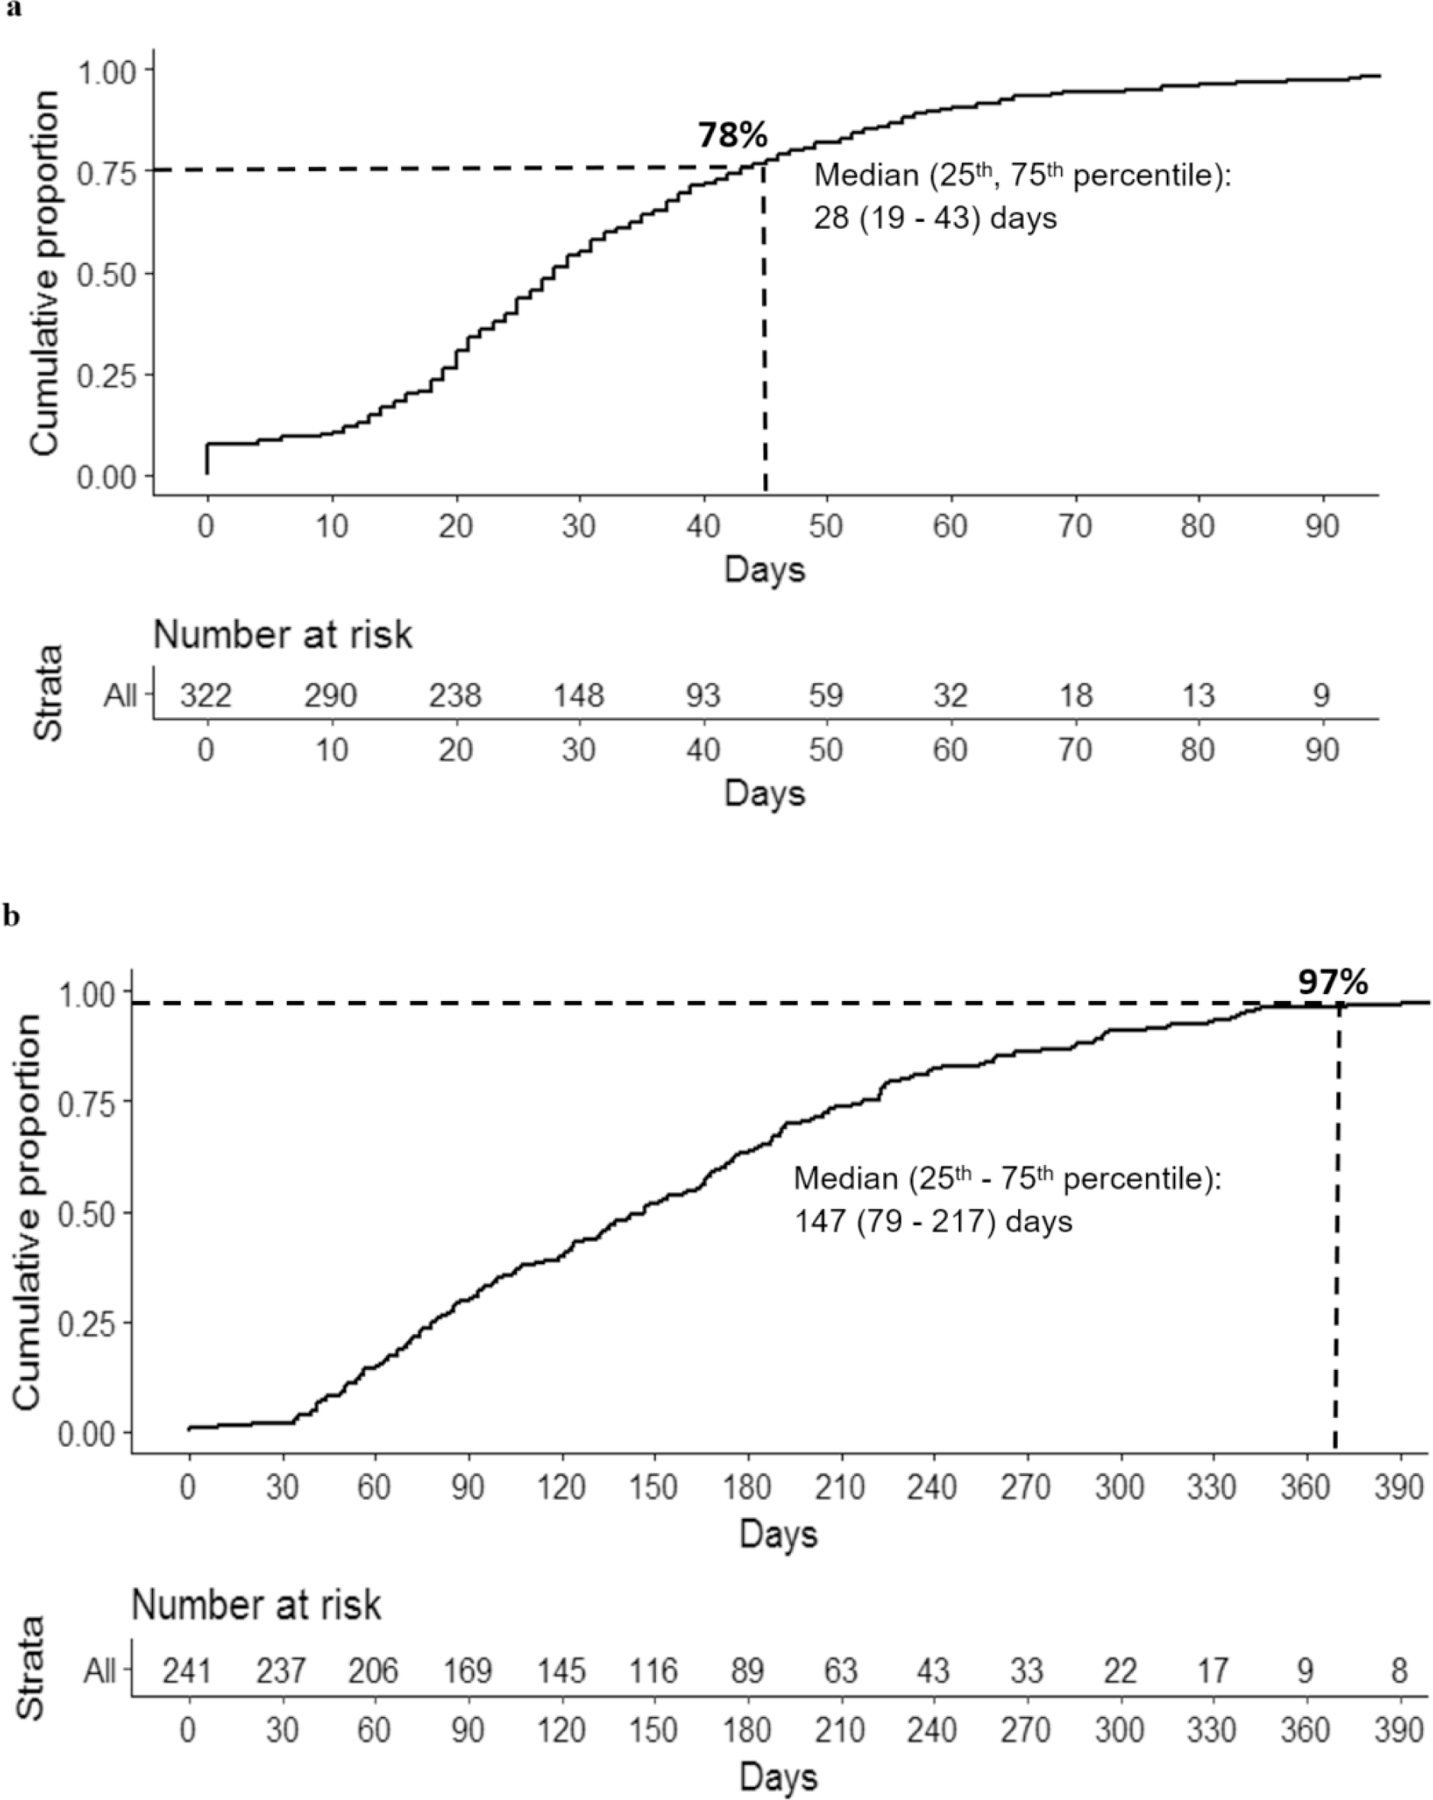
a. Kaplan Meier curve summarizes the timeliness of care of the 45-day time-to-surgery benchmark. The number of patients who had not received surgery over time is presented at the bottom of the figure. At day 45, 77% of patients who had surgery as the first recommended treatment received surgery. b. Kaplan Meier curve summarizes the timeliness of care of the 1-year (yr) time-to-hormone therapy benchmark. Median day (25th- 75th %). The number of patients who had not started hormone therapy over time is presented at the bottom of the figure. At 1 yr, 97% of patients who were stage I-III and hormone receptor-positive started the hormone therapy.