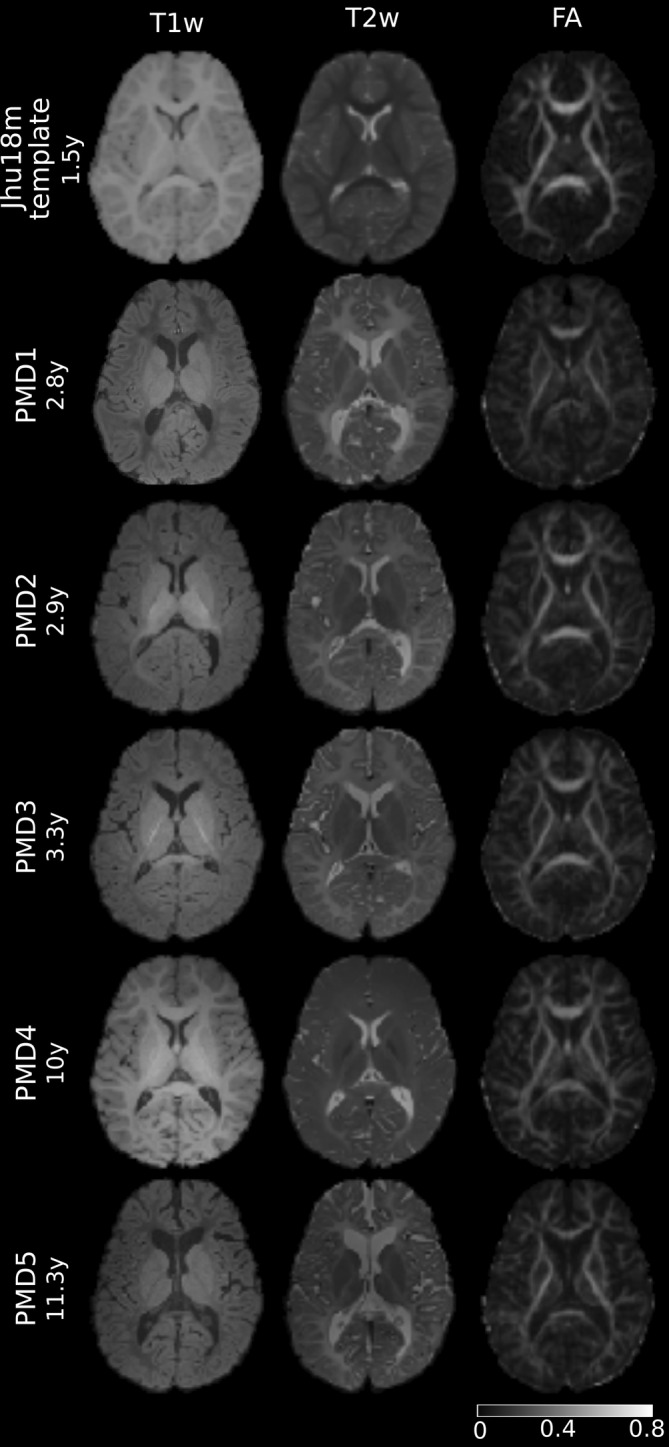
FIGURE 2.

Cerebral axial T1w, T2w, and FA images of the registration dataset aligned to JHU18m template. Upper row: JHU18m template from a 1.5‐year‐old healthy participant. Rows 2–6: PMD patients of different ages, reflecting the inhomogeneous range of T1w and T2w tissue contrast, whereas FA‐image contrast was more similar in these hypomyelinated states with widely varying degrees of maturation.
