Figure 10.

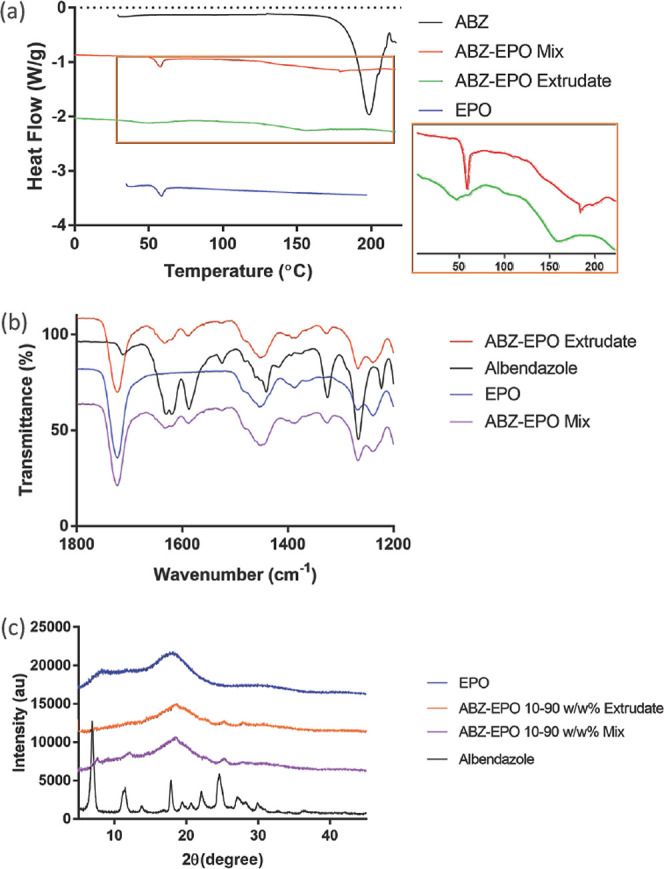
Overlain comparisons of the DSC thermograms (a), FTIR spectra (b), and PXRD patterns (c), respectively, comparing ABZ, EPO, physical mixture of ABZ and EPO at 10% w/w ABZ, and the corresponding extrudate.

Overlain comparisons of the DSC thermograms (a), FTIR spectra (b), and PXRD patterns (c), respectively, comparing ABZ, EPO, physical mixture of ABZ and EPO at 10% w/w ABZ, and the corresponding extrudate.