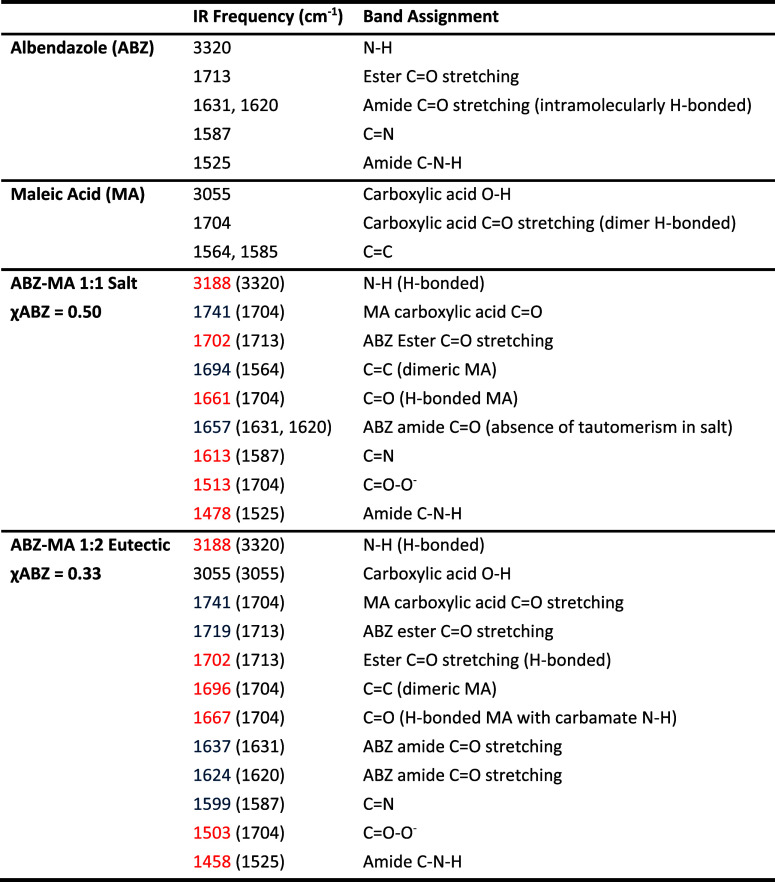
Table 2. FTIR Assignment of the Main Absorption Bands for ABZ, MA, the Equimolar ABZ–MA Salt, and the 1:2 ABZ–MA Eutectica.
Note the values presented in the parentheses represent the original band positions in the pure parent compounds, whereas the colors represent whether the band was observed to have red- or blue-shifted.

