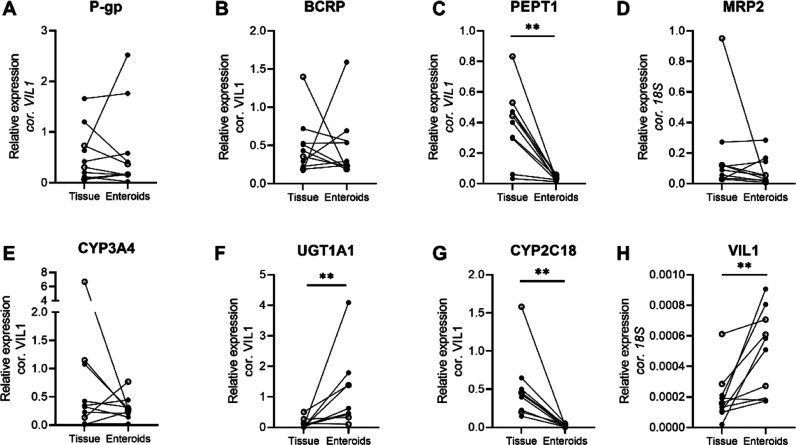
Figure 3.
Gene expression in all tissues and enteroid paired donor samples relative to Villin-1 (VIL1), Villin-1 relative to 18S. Similar expression in tissue and enteroids is shown for P-gp, BCRP, MRP2, and CYP3A4. PEPT1, UGT1A1, CYP2C18, and VIL1 show deviating expression between tissue and enteroids. Individual dots represent individual donors for tissue and enteroids. Enteroid values are given in median expression of different passages per donor. In Figure S1, individual tissue and enteroid passage numbers for each donor are plotted in a boxplot representation. Open circles indicate adult donors, and closed circles indicate pediatric donors. (A) P-gp (ABCB1), (B) BCRP (ABCG2), (C) PEPT1 (SLC15A1), (D) MRP2 (ABCC2), (E) CYP3A4, (F) UGT1A1, (G) CYP2C18, and (H) Villin-1. **: p < 0.01, exact p-values and median values per group are presented in Table S3. Age-dependent variation of ADME genes in enteroids and tissue.

