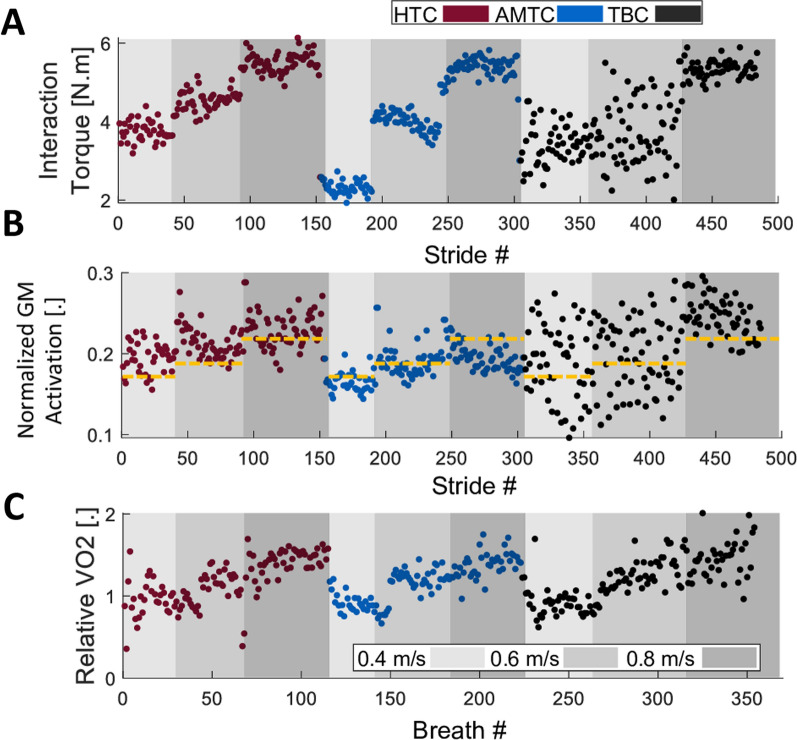
Fig. 4.
Examples of a typical participant’s (#9) experimental data; for ease of visualization and interpretation, only the interaction torque at the right hip and activation of one of the muscles are illustrated here along with the relative oxygen uptake. A The mean absolute interaction torque at the right hip at each stride with each controller and speed for Participant #9. B Normal muscle activation for the Gastrocnemius Medialis (GM) at the right leg. The dashed line represents average activation during no-exoskeleton walking. GM was chosen since it showed the strongest sensitivity to changes in the controller. C Relative oxygen uptake with respect to no exoskeleton walking for each breath for each controller and speed. The oxygen uptake has increased with the increase in treadmill speed

