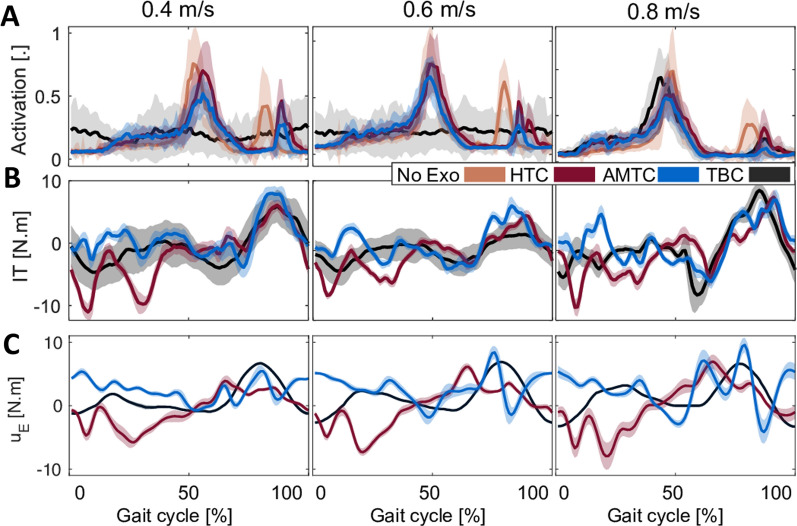
Fig. 5.
Muscle activation, interaction torque, and exoskeleton applied torque profiles with respect to the gait phase for participant #9. A The average normalized muscle activation pattern for the TBC, HTC, and AMTC blocks for the right Gastrocnemius Medialis during walking at 0.4, 0.6, and 0.8 m/s. The shaded area represents the standard deviation of the muscle activation about their mean value. Similarly, the average human–exoskeleton interaction torque and exoskeleton joint torques at the right hip are plotted in B and C, respectively

