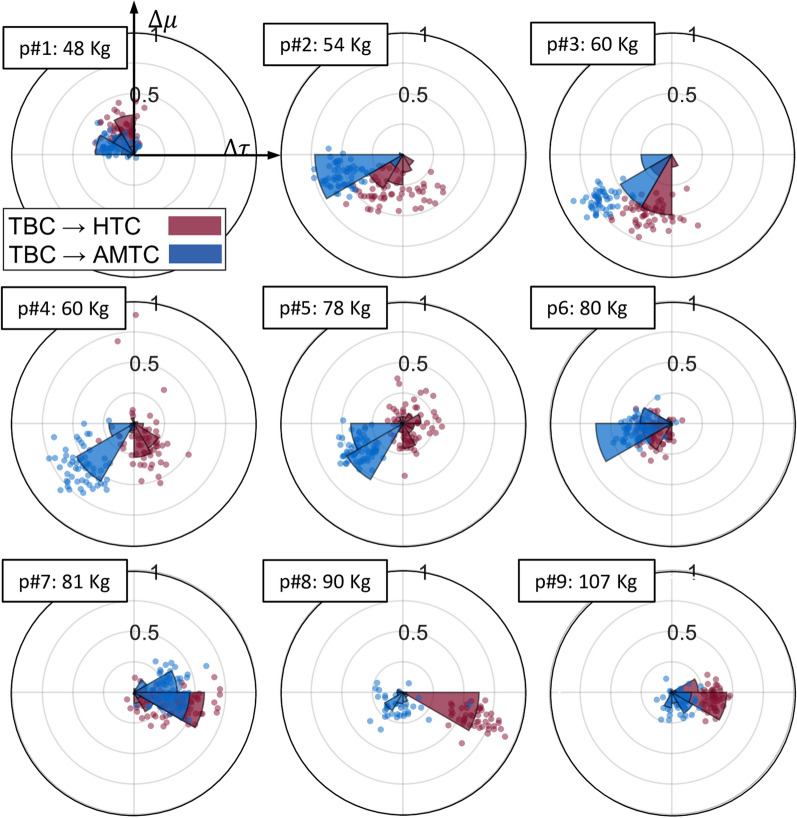
Fig. 8.
Interaction portrait distribution along with their polar histogram for HTC and AMTC blocks with respect to the average total muscle effort and total interaction torque across all strides during the TBC block graphed for each participant plotted for walking at 0.8 m/s. The radial coordinate of data points is normalized with respect to the maximum radius computed across all participants’ strides. Participants are arranged increasingly according to their body mass. The polar histograms show the concentration intensity of the depicted points. Each bin of the histogram covers rad

