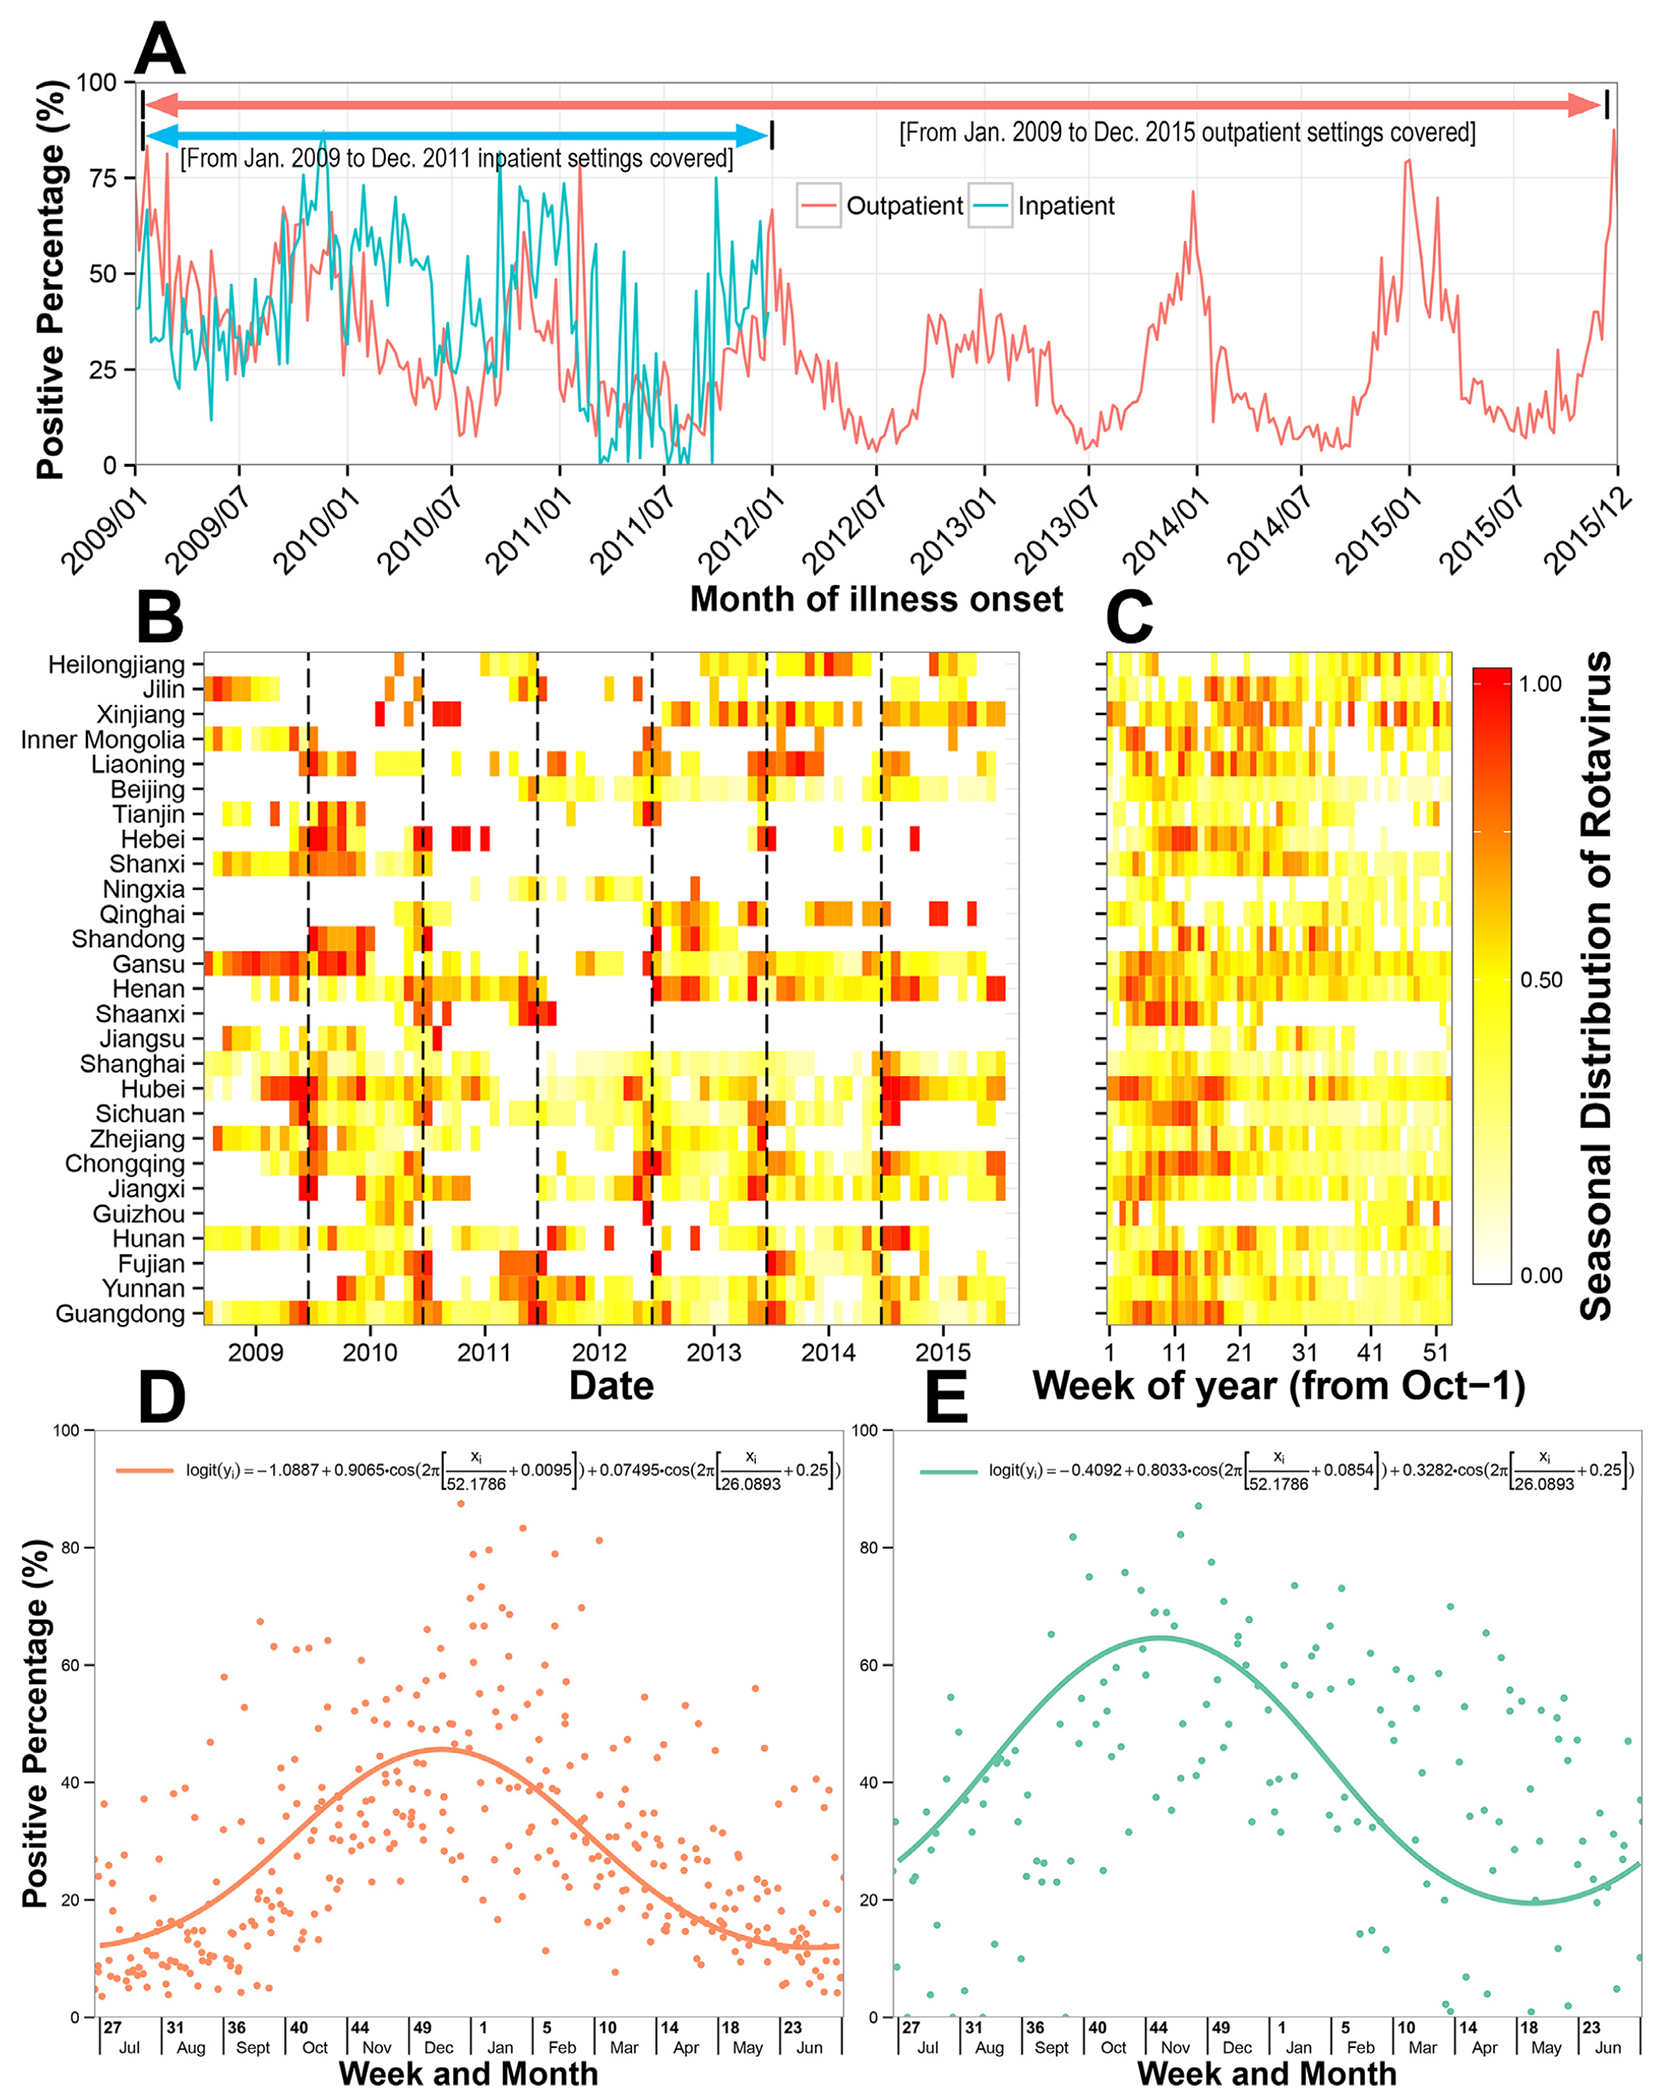
Fig. 2.

Temporal trends of rotavirus infection in children with diarrhea in China, 2009–2015. (A) Time series of weekly positive percentage of rotavirus, by hospital setting; (B) Heat map of monthly positive percentage of rotavirus, scaled from 0 to 1 according to percentile rank, by province; (C) Heat map of average weekly positive percentage of rotavirus, scaled from 0 to 1 according to percentile rank, by province; (D) The weekly positive percentage of rotavirus in outpatients, with a fitted seasonal curve superimposed; (E) The weekly positive percentage of rotavirus in inpatients, with a fitted seasonal curve superimposed.
