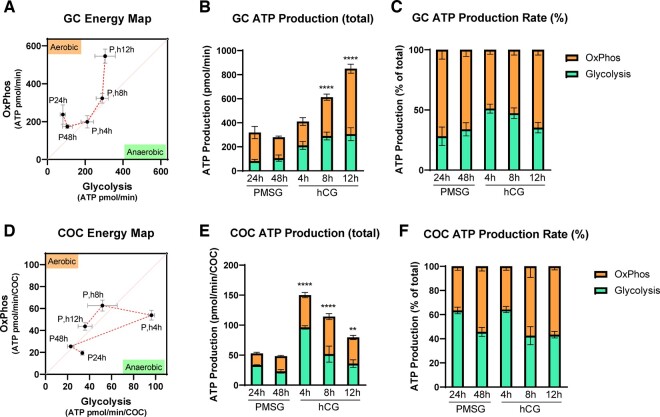
Figure 3.
ATP production via oxidative phosphorylation (OxPhos) and glycolysis in mouse granulosa cells (GCs) and cumulus–oocyte complexes (COCs) in response to ovulatory hormones. O2 consumption (OCR) and extracellular acidification (ECAR) in GCs and COCs collected from mice at 24 and 48 h after PMSG (P), and 4, 8, and 12 h after hCG (h) are used to generate energy maps and to infer ATP production rates. Energy maps in GCs (A) and COCs (D). The sequence of the ovulatory time course is indicated by the red dotted lines. Quantification of inferred ATP production in GCs (B) and in COCs (E). Percentage of OxPhos versus glycolysis in ATP production in GCs (C) and in COCs (F). N = 4–8 pools of GCs from multiple mice collected at each timepoint. N = 3–10 pools of COCs collected from the same mice. Data shown as mean ± SEM. Statistical analysis (B, C, E, F) by one-way ANOVA with comparison to cells collected at PMSG 48 h. **P < 0.01; ****P < 0.0001 compared to PMSG 48 h.

