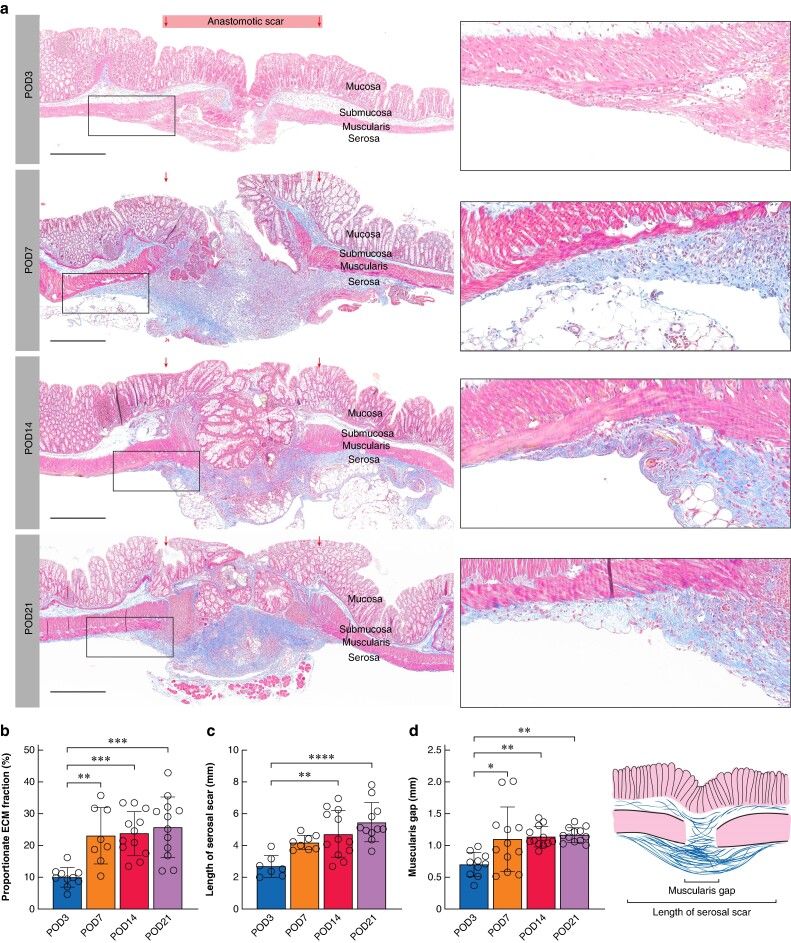
Fig. 3.
Histological evaluation of murine intestinal anastomosis
a Overview scans of Masson’s trichrome–stained histological sections of murine anastomoses at postoperative day (POD) 3, 7, 14 and 21. Scale bar = 500 µm, 400× magnification. Gradual accumulation of extracellular matrix (ECM) on the serosal side of the anastomosis can be seen from POD 7. b Proportional ECM fraction within the anastomotic scar compared to the total tissue area in % for POD 3–21. c Length of the serosal scar in mm for POD 3–21. d Muscularis gap in mm for POD 3–21. Schematic representation of histomorphometric parameters at the lower left. b–d n = 4–6 per time point with two technical replicates per sample. One-way ANOVA with Tukey’s multiple comparison test, *P < 0.05, **P < 0.01, ***P < 0.001, ****P < 0.0001. Data are mean(s.d.) with dots for individual values.

