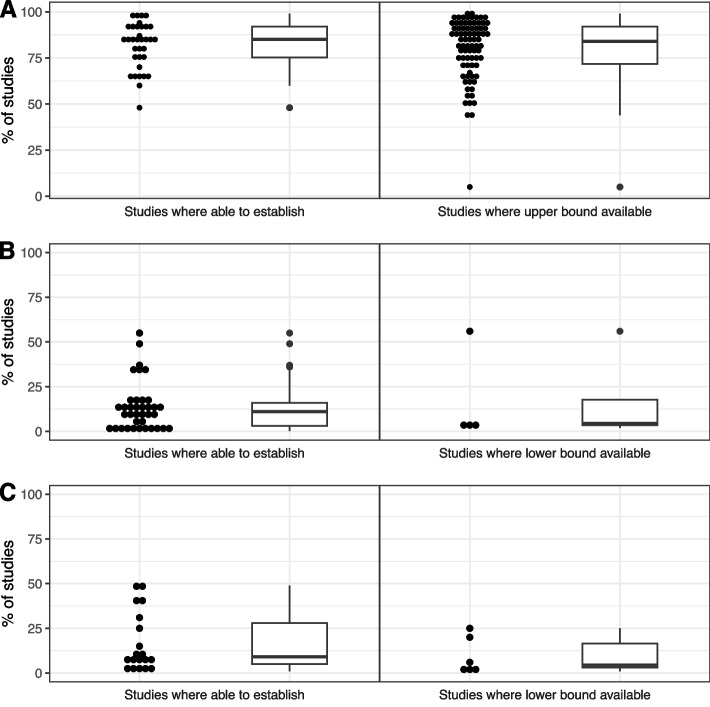
Fig. 2.
Dot plots and histograms showing the extent of missing data as a proportion of all participants in the analysis sample (see text for definition). A) no missing data (complete cases); B) missing values in the exposure; C) missing values in the outcome. Left panels: restricted to studies where the percentage could be established; right panels: restricted to studies where the exact percentage could not be established but a conservative bound on the percentage could be established

