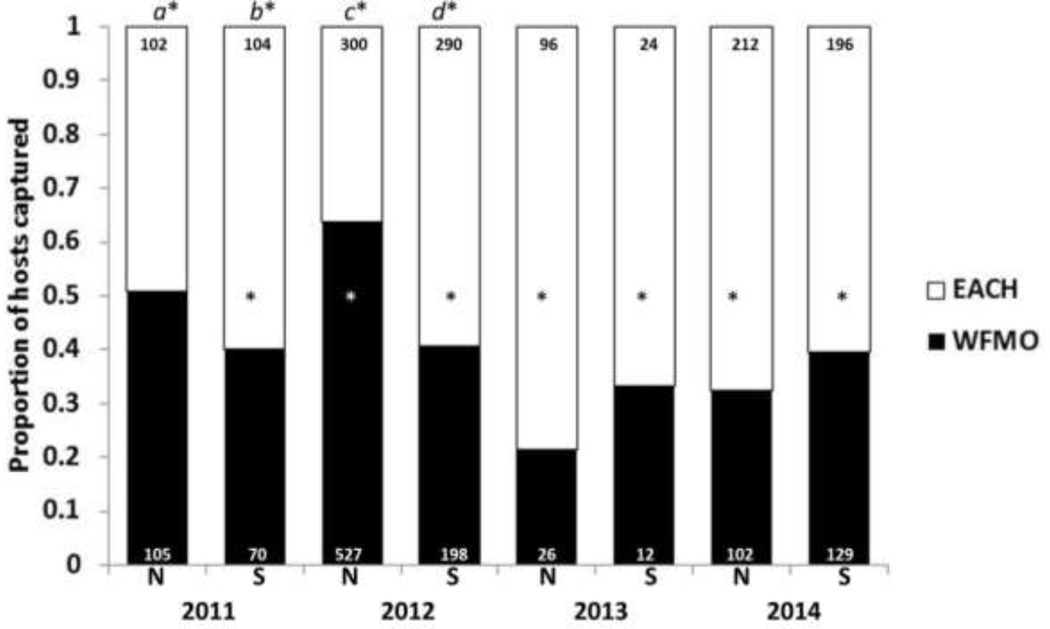
Figure 3. Proportion of white-footed mice (WFMO; black) and eastern chipmunks (EACH; white) captured each year (2011–2014) on NMI (N) and SMI (S):
The number within each bar indicates the total number of unique mice (black) and unique chipmunks (white) captured; this only includes first-time captures within a trapping session. The asterisk within the bar itself indicates that there was a statistically significant difference (z-score) between WFMO and EACH capture success for that year/site. The letter and asterisk above the bar indicate a statistically significant difference (z-score) between sites (the proportions of WFMO and EACH captured on NMI vs. the proportions of WFMO and EACH captured on SMI in a given year). (a*, b*: 2011; c*, d*: 2012).

