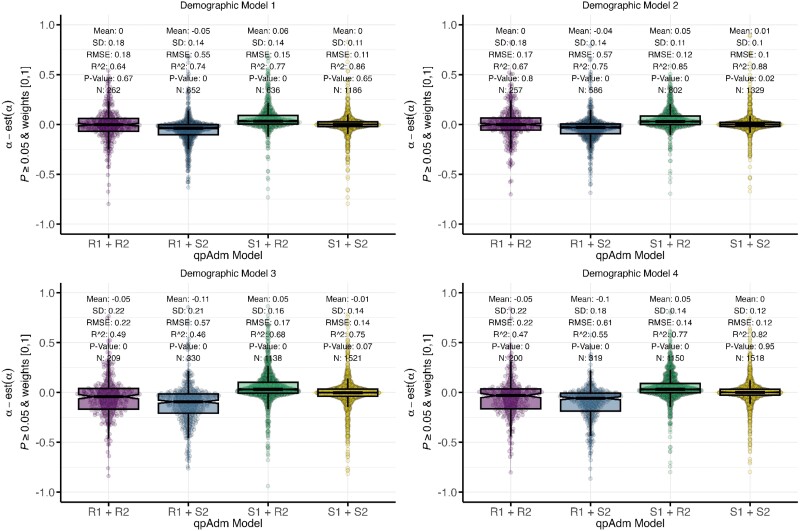
Fig. 6.
Deviations of estimated from simulated admixture proportions for the R1 and S1 sources in the qpAdm models S1 + S2, R1 + R2, R1 + S2, and S1 + R2. Median pairwise FST between the S1, S2, R1, R2, and R3 populations is between 0 and 0.02, and the number of generations since admixture is less than or equal to 100. Each panel shows results for one simple demographic model.

