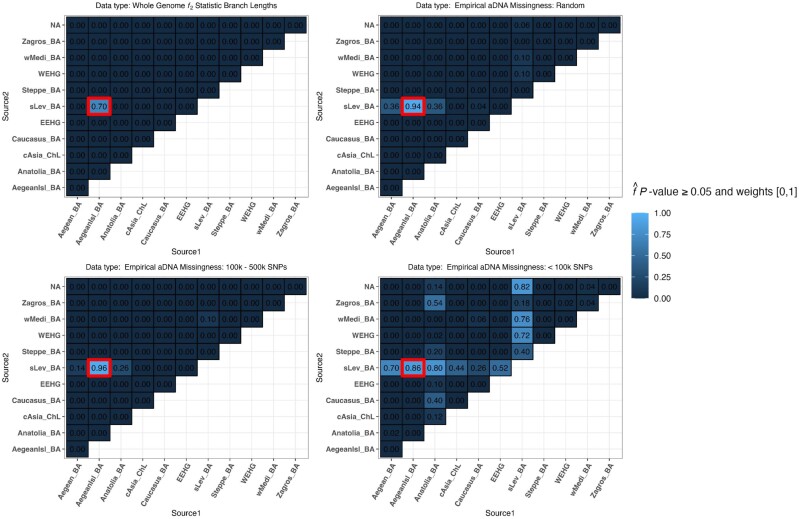
Fig. 7.
Heatmaps of the proportion of replicates with plausible P-value ≥ 0.05 and weights [0,1] for the complex demography (Aegean Island admixture to Southern Levant) for the target population “sLev IA1.” The thick outlined red box represents the most optimal true model. The results are presented for four data sets: f2-statistics calculated on whole-genome branch lengths and the three data sets with varying SNP missing rates.

